
 Global reach, higher impact
Nanotheranostics 2026; 10:93-103. doi:10.7150/ntno.132261 This volume Cite
Research Paper
A Rapid, High-Resolution Chromatographic Method for Isolating Subpopulations of HEK293-derived Extracellular Vesicles
Raphael Ewonde Ewonde, William F. Pons, R. Kenneth Marcus ![]()
Department of Chemistry, Biosystems Research Complex, Clemson University, Clemson, SC 29634-0973, USA.
Received 2026-1-28; Accepted 2026-3-14; Published 2026-4-16
Abstract

Rationale: In recent years, significant advances have been made in understanding the basic underlying science of extracellular vesicles (EVs). This has opened multiple avenues for potential application, especially in areas such as biomarker discovery and drug delivery (vector) systems. Nonetheless, to achieve this, challenges such as the lack of reproducible isolation methods with high resolving power, especially for enriching subpopulations of EVs, need to be tackled. Here, we developed a hydrophobic interaction chromatography (HIC) method utilizing cost-effective polyester fiber columns for the isolation of EVs.
Methods: Human embryonic kidney (HEK)-293 cells were cultured in shake flasks, centrifuged and filtered to remove cells and cell debris, respectively. The clarified media was injected onto capillary-channeled polymer (C-CP) fiber columns in HIC mode using step gradients. Alternative gradients that combine both positive and negative steps (termed a switchback gradient) during EV elution were scouted to improve the separation of partially resolved peaks. The optimized method was transferred to an analytical-scale column, and peaks were collected using an integrated fraction collector. For downstream characterization, fractionated peaks were buffer exchanged using Amicon filters with a 10 kDa molecular weight cut-off.
Results: Polyester fiber columns, operated with both positive and negative step gradients during EV elution, yield baseline separation of three EV peaks within 12 minutes. Retention times show high repeatability (<0.33% RSD) and reproducibility (<1.3% RSD) across three column batches. Characterization of each peak fraction using nanoparticle tracking analysis (NTA) and nanoflow cytometry (nFCM) revealed similar trends in the size variation. The variation in the surface markers CD9 and CD81 among the collected fractions was confirmed by nFCM in the fluorescent detection mode, while intact double-layer and cup-shaped vesicles were observed in transmission electron microscopy (TEM) images.
Conclusions: We demonstrated here, for the first time, a rapid chromatographic method for isolating and enriching EV subpopulations based on their chromatographic behavior which is reflective of their hydrophobicity (potentially a function of size or surface protein density) in a single unit operation. Three discrete size populations of EVs (based on NTA and nFCM sizing) were baseline separated within 12 minutes. Preliminary characterization of surface protein composition via nFCM showed significant differences among the isolated subpopulations.
Keywords: Extracellular vesicles, polyester fibers, HEK293, subpopulation isolation, hydrophobic interaction chromatography, reproducibility, high-resolution method.
Introduction
Extracellular vesicles (EVs) are cell-derived nanovesicles with sizes ranging from 40 nm to 1000 nm, defined by a lipid bilayer membrane surrounding an aqueous lumen. The molecular content of EVs includes lipids, proteins, nucleic acids, metabolites, and other soluble mediators that can alter cellular processes [1, 2]. This makes EVs highly heterogeneous, not only in their molecular composition, but also in terms of size and density. Notably, EVs in the lower size range (< 200 nm), generally termed exosomes, are known to possess several key attractive attributes, including biocompatibility and immune tolerance [3]. deep tissue penetration,[4] cellular uptake,[5] and suitability for genetic manipulation [6]. These intrinsic attributes have contributed to the growing interest in EVs in recent years, particularly for potential clinical applications and therapeutic development [7-10]. However, limitations in separation and characterization methods, as well as functional studies, remain the major bottlenecks hindering the development of translational therapeutics.
While functional subpopulations exist between EVs from different sources, even EVs from the same source and cell type have been shown to possess different molecular composition in both physiological and pathological conditions. As such, heterogeneity analysis is crucial for elucidating the composition of various subpopulations and, therefore, the specific physiological functions [11]. Assigning the functions of EVs to the bulk population hampers advances in practical applications, for instance, in therapeutics; the presence of subpopulations that lack the desired effect will result in reduced potency.
EVs can be isolated from a wide range of sources, such as biofluids (blood, urine, saliva), as well as cell culture, which is preferred for large-scale production [12]. The human embryonic kidney (HEK)-293 cell line has been used for EV production, with the culturing conditions becoming well established [13, 14]. This cell line offers several advantages, including a rapid growth rate, batch-to-batch reproducibility, and minimal growth requirements in suspension culture using chemically defined or serum-free media [2, 12, 13]. A plethora of EV isolation methods exists, each with its own pros and cons [13, 15-17]. Size and density-based methods, such as ultracentrifugation, size exclusion chromatography, and density gradient ultracentrifugation, are the most frequently used [18]. However, these methods offer limited resolving power and often lead to co-isolation of contaminants having similar sizes and densities; hence, they cannot selectively enrich EV subpopulations. Therefore, there is a critical need for facile, high-resolution methods that can enrich subpopulations of EVs [19]. This will enhance downstream characterization and ultimately facilitate an understanding of EV heterogeneity biology, as well as the discovery of EV-based biomarkers and therapeutics [12, 13, 19]. The membrane of EVs is essentially decorated with surface proteins, conferring a degree of hydrophobicity that can be exploited for separation in hydrophobic interaction chromatography (HIC). In this regard, our group has extensively used HIC for isolation of EVs from diverse sources (milk, urine, cell culture media), applying polymer fibers as a stationary phase in capillary column format and spin-down tips [20-26]. Here, we describe and demonstrate a novel, cost-effective “switchback gradient” method based on HIC for the high-resolution isolation of EV subpopulations from HEK293 cell cultures.
Methods
Chemicals and materials
Ammonium sulfate (≥99.0%), disodium hydrogen phosphate (≥99.0%), sodium dihydrogen phosphate (≥98.0%), sodium hydroxide, and Amicon Ultra-15 (10 kDa MWC) spin vials were purchased from Sigma-Aldrich (Spruce Street, MO, USA). HPLC-grade acetonitrile (ACN) was purchased from VWR Chemicals (Radnor, PA, USA), and Ultrapure water was produced in-house using an ELGA LabWater purification system (PURELAB flex, High Wycombe, UK). Carbon-coated 200 mesh grids and uranyl acetate were purchased from Electron Microscopy Sciences (Hatfield, PA, USA).
Instrumentation and experimental conditions
HIC experiments were performed on a Vanquish Flex UHPLC system (Thermo Fisher Scientific, Sunnyvale, CA, USA), consisting of a quaternary pump F, a split sampler FG, a UV-Vis photodiode array detector VF equipped with a 13 µL flow cell, and an integral fraction collector FT. Viper MP53N tubing was used to connect the different UHPLC modules. Samples were maintained at 5 °C in the autosampler and fraction collector. The injection volume was set at 4 µL, and the flow rate was set at 0.5 mL min-1, unless stated otherwise. Optical absorbance data were recorded at a wavelength of 216 nm, at a sampling rate of 5 Hz and a response time of 1 s. Chromeleon software (version 7.3.2) was used for instrument control and data management.
Mobile phase and sample preparation
The quaternary mobile phases (MPs) used were prepared using Ultrapure water and consisted of 2 M ammonium sulfate in 50 mM phosphate (MP-A), 1 M ammonium sulfate/ 10% ACN in 50 mM phosphate (MP-B), 35% ACN in 50 mM phosphate (MP-C), and 50 mM phosphate buffer (MP-D). The mobile phase pH was adjusted by adjusting the ratio of disodium hydrogen phosphate and sodium dihydrogen phosphate [27]. The pH was adjusted to 7.0 by the addition of a 2 M sodium hydroxide solution. MPs were filtered through a 0.22 µm pore, 500 mL polyethersulfone (PES) vacuum filtration unit (VWR, Radnor, PA, USA).
The cell stocks used throughout this study were derived from HEK293F Viral Production Cells 2.0 (Gibco, Waltham, MA, USA), and cell culture supernatants were obtained from the Harcum lab (Department of Bioengineering, Clemson University). Cells were cultured in shake flasks, and collected fractions were centrifuged at 700 × g for 5 minutes to remove cells. The supernatant was filtered through a 0.2 µm PES filter to remove cell debris. The clarified culture medium (CCM) was aliquoted into 2 mL tubes and stored in -80 °C until use. The EV concentration in the stock sample was determined to be ~1.48 × 10¹¹ particles mL-1.
Assembly of polyester capillary-channeled polymer (C-CP) fiber columns
Trilobal PET C-CP fiber microbore columns were prepared in-house with slight modifications from our previously described method [28, 29]. Briefly, eight rotations of fibers (528 individual fibers) were pulled through a 0.76-mm internal diameter (I.D.) PEEK tubing (IDEX Health & Science LLC, Oak Harbor, WA, USA) and trimmed to 30 cm in length. The 15 cm microbore columns were prepared similarly and then cut in half. Prior to use, columns were flushed for 10 minutes with 100% MP-C, then with 100% MP-D for 10 minutes, and equilibrated for 5 minutes with 100% MP-A. Columns were stored at room temperature until further use. For the EV isolation for downstream characterization, PET fibers were assembled in a 15 cm long analytical scale column having a 2.1 mm internal diameter (Chrom Tech, Apple Valley, MN, USA) with 40 fiber rotations. For optimal recovery, after appreciable decrease in peak area (typically 12 injections), fibers were flushed out of the column with water by applying a very high flow rate (6 - 8 mL min-1) while keeping the column outlet open (i.e., without the frit and frit holder) and new fibers placed in the column. Additionally, to assess the reproducibility and run-to-run repeatability of the column assembly, the fibers were flushed out after each set of successive injections, and replaced with new fibers.
Nanoflow cytometry
Isolated fractions from HIC separation were characterized using a NanoAnalyzer instrument (NanoFCM Inc., Nottingham, UK) equipped with dual 488/638 nm lasers for simultaneous side scatter (SSC) and fluorescence detection. Bandpass filters (488/10 nm, 525/40 nm, and 670/30 nm) were used for signal collection in the respective channels. Instrument alignment and size/number density calibration were performed according to the manufacturer's instructions prior to analysis. Fluorescent silica microspheres (0.25 µm, 2.17 × 10¹⁰ particles mL-1) were diluted 1:100 and used to align optics and lasers, and to standardize particle concentration. A silica nanosphere cocktail (SM16-Exo, 68-155 nm) was used to generate a size calibration curve. For fluorescence labeling, samples were diluted in 50mM phosphate buffer and incubated with MemGlow 640 dye (1:2500; Cytoskeleton Inc., USA) for membrane labeling and ExoBrite CD9 and CD81 antibodies (1:4000; Biotium, USA) for tetraspanin detection. Incubation was performed at 37 °C for 3 hours in a water bath. The sample delivery pressure was maintained above 160 kPa, and the sampling pressure was set to 1 kPa. The system was flushed with the manufacturer's recommended cleaning solution, and the external capillary was rinsed by dipping in water between samples. Sample data sets were acquired for 30 seconds. nFCM Profession V2.0 software was used for system control and data processing.
Nanoparticle tracking analysis
Nanoparticle tracking analysis (NTA) was used to determine the size distribution of the fractions and operated according to manufacturer's instructions. The Malvern NanoSight NS300 (Malvern Panalytical, Great Malvern, UK), controlled by the NanoSight NTA 3.4.4 software, was used for all measurements. The camera (sCMOS) and detection settings were not altered unless necessary; however, minor adjustments were made to minimize background noise. The camera level was maintained at 13-14, and the frame rate at 25 frames sec-1. Measurements were taken at ambient temperature, with the sample viscosity set by the software automatically. Samples were loaded into the flow cell with flow rate = 1000 (instrument units) for 20 seconds, followed by a flow rate = 100 for 120 seconds. Data acquisition proceeded with a 60-second imaging time, at flow rate = 100, with five replicates. Between each sample, the flow cell was purged first with DI H2O, then 10% IPA, for 2 minutes each with a flow rate of 1000. A syringe filled with air (~3 mL air) was then gently pushed into the inlet line to remove liquid from the flow cell. The ideal detection threshold was set on a sample-to-sample basis, with a debris count (blue cross count) less than 5, and a particle count greater than 30 per frame. This value varied from a detection threshold of 5 to 10. The blur size and max jump distance were controlled automatically.
Transmission electron microscopy
TEM imaging was employed to verify the sizing and physical structure of the EV isolates. Each whole peak fraction (indicated in Fig. 2A) was buffer exchanged to 20 mM HEPES buffer, pH 7.0, and 10 µL of each whole peak fraction was placed on parafilm. Next, 10 µL of 1% uranyl acetate was pipetted onto the sample on the parafilm and mixed by pipetting up and down. The Carbon grid was then placed on the sample, facing down, and allowed to incubate for 15 s. The excess sample was blotted using lint-free paper. Grids were placed in a desiccator overnight and then imaged using a JEOL instrument with a 200-ms exposure time, an NS15 camera, and an accelerating voltage of 120 kV.
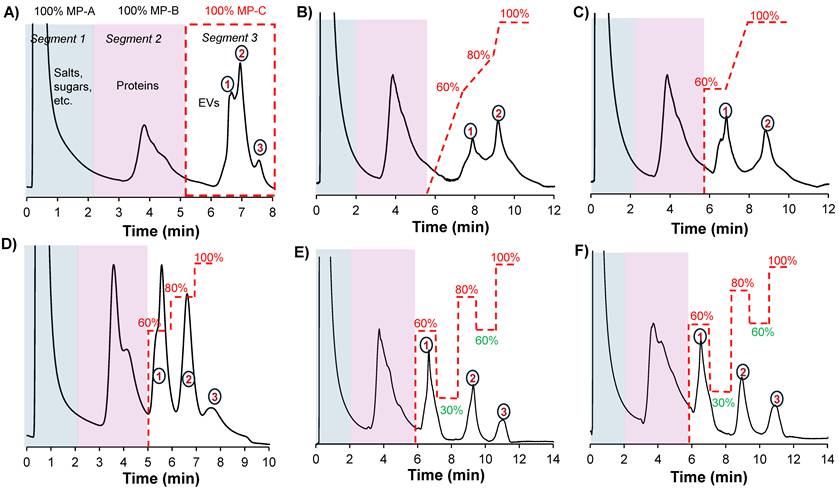
A) Chromatographic profile obtained when applying a generic gradient on a 0.76 mm x 15 cm column. Scouting gradient runs on a 0.76 mm x 30 cm column showing chromatographic peak profiles when applying B) a multilinear gradient, C) a combination of isocratic step gradients and a linear gradient and D) a multi-isocratic step gradient. The application of multi-isocratic step gradients with both positive and negative steps enabled the high-resolution separation of EV subpopulations on E) a 30 cm and F) 15 cm column. The flow rate was set to 0.5 mL min-1, and MP-D was delivered in-line with MP-C to modulate its effective composition during the run; for example, a composition of 60% MP-C included 40% MP-D. Gradient lines are guides for the eye and not drawn to scale.
Results
Development of alternative gradient methods to isolate subpopulations of EVs
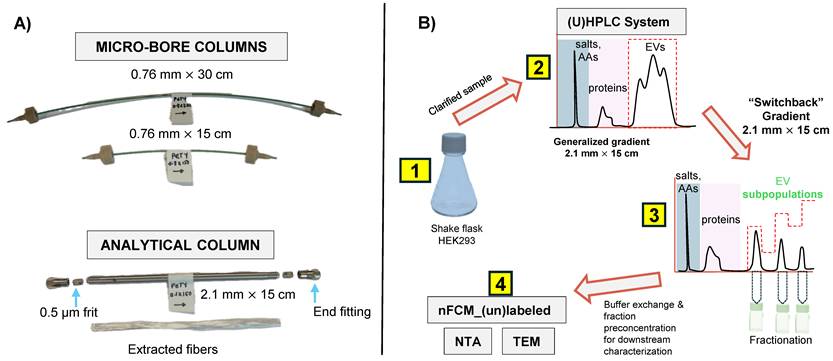
The different column formats and a flow chart highlighting the general experimental steps used in this study are depicted in Figs. 1A and B, respectively. In a recent study, we demonstrated the repeatability of the 15 cm long x 0.76 mm I.D. polyester (PET) capillary-channeled polymer (C-CP) fiber microbore columns investigated towards the routine analysis of whole populations of HEK293-derived EVs, yielding < 0.6% RSD for retention time and < 3% RSD peak area across 10 columns from five batches. Figure 2A shows the chromatographic profile obtained when using the microbore column format and applying a generic step gradient consisting of three segments [25]. In Segment 1, 100% mobile phase A (MP-A) is applied for 2 minutes to capture proteins and EVs, while media components, such as amino acids, sugars, and vitamins, elute with the injection volume. Next, 100% MP-B is applied for 3 minutes (Segment 2) to elute retained culture-derived proteins. Finally, 100% MP-C is applied for 3 minutes (Segment 3) to elute the target EVs. Interestingly, the EVs eluted as a broad peak with shoulders, suggesting the presence of partially resolved subpopulations having similar retention characteristics.
A) PET fiber columns in different formats. The microbore columns (0.76 mm I.D.) were used during the initial scouting runs, with the longer column used to achieve higher peak capacity. Capillary columns were cut to the desired length using a hard razor. The optimized separation method was applied to the analytical-scale column (2.1 mm I.D.) for sample enrichment prior to downstream characterization. A representative bundle of fibers extracted from the column is also shown. B) The overall experimental workflow applied in this study is summarized. AAs = amino acids, ccm = clarified culture media.
To improve the resolution, and intending to fully resolve these peaks, a systematic approach involving scouting runs with modifications in Segment 3 was performed, using MP-D (see the Method section for details) to modify the gradient composition. Multistep linear gradients, isocratic step gradients and a combination of both were scouted. Additionally, the column length was increased to 30 cm to increase the peak capacity. Figures 2B and C illustrate the elution profiles obtained when applying a multistep linear gradient and the combination of isocratic step gradients and a multistep linear gradient. With the multilinear gradients, a slight improvement in resolution is observed between the first two peaks as evidenced by the better-defined valley between the two peaks, but the anticipated resolution obtained for the third is not realized (Fig. 2B). When using a combination of isocratic step gradients in combination with a linear gradient, peaks 1 & 2 are almost baseline separated; however, the third peak is still not apparent (Fig. 2C). Generally, it was observed that the isocratic step gradients performed better than linear gradients. Our previous results demonstrated that linear gradient elution programs lead to prolonged analysis times and suboptimal recovery of the target EVs [30]. This could potentially be due to the hydrophobicity of the stationary phase, which necessitates the use of step gradients with isocratic holds at high elution strengths to achieve the efficient desorption of the retained target vesicles. Therefore, only isocratic step gradients were used in subsequent scouting experiments.
When applying multistep isocratic gradients in Segment 3, comprising of 60%, 80%, and 100% MP-C for 1 min each, a significant improvement in the separation was observed, with the third peak becoming more apparent (Fig. 2D). To further improve the separation with the aim of achieving baseline resolution, the concept of a negative gradient, as has been demonstrated for closely-eluting proteins under RPLC conditions [31], was applied. By introducing a negative gradient step (i.e., 30% MP-C) after eluting the first peak with the 60%, the second peak is retained relatively longer and then eluted with the 80% step. Similarly, by introducing a negative gradient step (i.e., 60% MP-C), elution of the last peak is delayed and then eluted at 100% MP-C. This resulted in a high-resolution separation of the three fractions (Fig. 2E). Note that the mobile-phase compositions were empirically determined. The optimized gradient was also tested on the 15 cm column, yielding the same separation profile (Fig. 2F). We term this general approach of positive and negative gradient steps a “switchback gradient”.
Verification of the quality and reproducibility of switchback HIC gradients on analytical-scale C-CP fiber columns
Microbore HPLC columns are beneficial because they enable high sensitivity with reduced consumption of sample and mobile phase.[32] However, they are limited by their mass/volume loading capacities, making them unsuitable when targeting downstream characterization where sample enrichment is required. In order to gain greater EV loading capabilities, fibers were assembled in 2.1 mm x 15 cm format analytical-scale columns. To increase the mass loading, the clarified HEK293 sample was preconcentrated to four times its original concentration using the Amicon 10 kDa MWC filters. With the preconcentrated sample, the maximum injection volume to maintain separation efficiency was empirically determined to be 2 μL. Beyond this volume, characteristic nonlinear features of column overload were observed. Figure 3A shows the chromatographic peak profile obtained using the optimized conditions for the larger column size. Clearly, the chromatographic program was transferable between the fiber column formats. For a qualitative assessment of the method stability and reproducibility, three different HEK293 samples were injected onto a column. These three samples originated from the same cell bank, but were cultured and harvested under slightly different conditions, and stored at -80 °C as the basis for a separate study regarding culture yields. An overlay of triplicate injections from each of the three samples (see Fig. 3B) shows similar chromatographic profiles, hence the method is stable and reproducible under the tested conditions.
A) The resulting chromatographic peak profile, obtained by applying the high-resolution switchback method on a 2.1 mm x 15 cm column. B) An overlay of chromograms from triplicate injections of three different HEK293 ccm samples shows reproducibility across different samples. C) Reproducibility of column assembly is also demonstrated on three different columns with an overlay of triplicate injections of the same sample per column. The flow rate was maintained at 0.75 mL/min. The same method was applied in A, B, and C, but is only shown in B for clarity. Dotted lines in (A) represent the peak collection window.
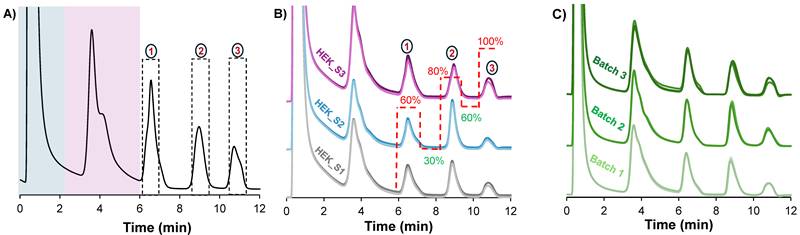
Additionally, the method repeatability and column batch-to-batch reproducibility was assessed by performing five replicate injections on each of the three different PET C-CP fiber columns. Again, very similar peak profiles were observed across all three fiber columns as visualized in Fig. 3C. For a quantitative assessment, the retention time, peak area and peak width-at-half-height of the second EV peak were used as performance metrics, with the resulting descriptive statistics summarized in Table 1. Excellent method repeatability was observed across the triplicate columns, with RSD values under 0.3% for retention time and below 7% for peak area and peak width within each column. With respect to column batch variability, the very slight difference (1.2%) in retention time across the three columns indicates a high level of consistency in retention time and strong robustness and intermediate precision. For the peak area and peak width values, a wider variation is observed, 17% and 25% respectively, which is not surprising when considering the relatively simplistic manual assembly of the fiber columns. Nonetheless, the values observed within each column batch are quite acceptable for this novel isolation from a very complex sample. Most importantly, in every instance, the complete temporal isolation of the three subpopulations is realized with ease.
Quantitative analysis showing data obtained from five successive injections (n = 5) on three fiber batches. Values are shown as Mean ± SD (%RSD), where SD is standard deviation and RSD is relative standard deviation. Peak @ w1/2 is peak width-at-half-height.
| Metric | Retention time (min) | Peak area (mAU.min) | Peak @ w1/2 |
|---|---|---|---|
| Batch 1 | 8.77 ± 0.01 (0.16 %) | 13.25 ± 0.70 (5.3 %) | 0.47 ± 0.03 (6.2 %) |
| Batch 2 | 8.82 ± 0.03 (0.32 %) | 15.53 ± 0.80 (5.2 %) | 0.42 ± 0.01 (2.7 %) |
| Batch 3 | 8.88 ± 0.02 (0.18 %) | 13.61 ± 0.89 (6.5 %) | 0.52 ± 0.03 (4.9 %) |
| Global Mean | 8.82 | 14.13 | 0.47 |
| Variation | 1.20% | 17% | 25% |
Multi-modal characterization and confirmation of distinct EV size subpopulations
As described previously, the existence of subpopulations of EV sizes and content is a central focus in the basic biochemistry of the vesicles [8, 10]. To assess the potential physical differences between the Segment 3 peak isolates and to confirm the presence of EVs in each peak, eluates were collected for each peak using the automated integral fraction collector, see highlighted regions on Fig. 3A. Fractions were pooled across 40 injections, buffer-exchanged to 50 mM phosphate buffer at 4500 rpm, 15 min at 8°C using 10 kDa Amicon filters (3 times) and then preconcentrated to a final volume of 1 mL. For comprehensive characterization, each fraction was first analyzed using nanoflow cytometry (nFCM), which revealed distinct size distributions for the fractions corresponding to peaks 1, 2, and 3, yielding median sizes ± SD of 67 ± 17 nm, 75 ± 30 nm, and 115 ± 30 nm, respectively (Figs. 4A-C). The size distribution corresponding to peak 1 is relatively narrow in comparison to peaks 2 and 3, with less skewing towards larger particle sizes as well. Peaks 1 and 2 have a similar size range (60-100 nm), although peak 2 has a relatively higher population between 80 and 100 nm. On the contrary, peak 3 reveals populations in the higher size range (~90 - 140 nm), with a significant population between 100 and 120 nm.
Size characterization of EV peaks using A-C) nanoflow cytometry and D-F) nanoparticle tracking analysis. Peaks 1 - 3 were pooled from 40 injections.
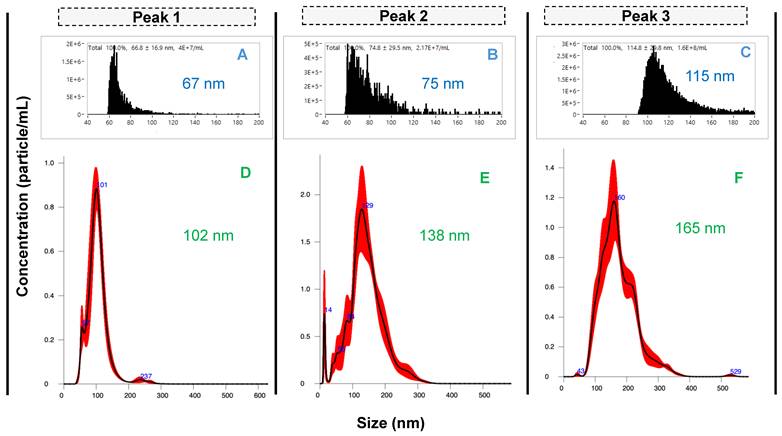
The differences in the size distributions among the fractions were further confirmed by NTA, a benchmark method in the realm of EV characterization [33, 34]. The product scattering data are presented in Figs. 4D-F, with the size ranges observed being in very good agreement between the nFCM and NTA, both in the ranges for small EVs (30 - 200 nm). The particle sizes determined by NTA increased across the respective elution fractions, with median size ± SD of 102 ± 32 nm, 138 ± 50 nm, and 165 ± 57 nm for peaks 1, 2 and 3, respectively. The difference in sizes between the particles observed by NTA are approximately greater by 45 nm than the respective sizes observed with nFCM. While there are reasons for the differences in the absolute values, three distinct size populations are clearly identified.
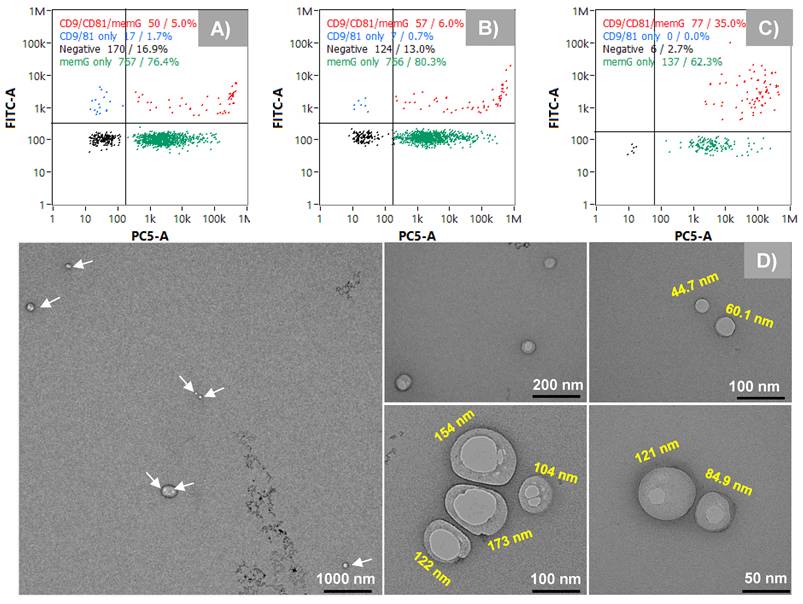
While the nFCM and NTA data clearly point to three distinct particle size populations, any approach to size select EVs must also confirm that those particles are indeed the intended products. To further assess the identity of the recovered particles as EVs, the fluorescence capabilities of the nanoFCM were employed to confirm the presence of the tetraspanin surface markers CD9 and CD81, probed with FITC-labeled anti-CD9 and anti-CD81 antibodies. In addition, membrane labeling with MemGlow confirmed the presence of vesicles having the characteristic lipid bilayer membranes. The representative quad-plots of Figs. 5A-C present the case wherein each of the collected fractions were double-positive for the tetraspanin probes and the membrane dye. As expected, the generic membrane probe coupling was more effective than the labelled antibodies as the target proteins exist in very low numbers on each EV. Very interestingly, while fractions 1 and 2 show 5 and 6% double-positive responses respectively, fraction 3 was significantly higher, up to 35%. While this difference in response could reflect the larger size of the particles (more tretraspanins to be labeled), it may also reflect fundamental differences in surface protein composition among the subpopulations, as has been postulated [11, 15, 19]. Since a cocktail of the FITC-labeled probes was used, the relative abundance between the individual tetraspanins across the different isolates cannot be inferred. This can be investigated using nFCM with individual probes or with single EV assays, such as direct stochastic optical reconstruction microscopy (dSTORM) [35]. The final form of EV confirmation was through TEM. Due to the low sampling efficiency of TEM, the entire EV peak was collected under high-throughput conditions (see Fig. 2A, Segment 3, where the whole peak was collected between 6 and 8 min). Here, the TEM images shown in Fig. 5D reveal a wide size range (45 nm - 173 nm), reflective of all three populations, and having the expected intact membranes and cup-shaped structures. As such, the designation of the collected fractions as subpopulations of EVs in the exosome size range is supported. Certainly, far greater numbers of EVs would need to be included in the TEM analysis to provide statistically-significant size conclusions.
A-C) Confirming the presence of EVs in isolated peak fractions using surface markers (CD9 and CD81) as probes and the bilayer membrane (MemGlow). D) Transmission electron microscopy (TEM) images showing vesicles with intact membranes.
Discussion
Conventional methods for isolating EVs mainly focus on recovering the bulk population of EVs, largely due to their low resolving power and the inherent heterogeneity of EVs. However, in liquid biopsy and biological function studies, for example, separating EV subpopulations has been found to provide critical insights [36]. With regards to therapeutic application, a current focus in the field is to identify and unravel the molecular composition of the EV population responsible for a desired function. Achieving this requires either refining existing methods or developing high-resolution methods. For example, Willms et al. employed sucrose density gradient centrifugation to isolate subpopulations of exosomes with distinct molecular and biological properties [11]. While this method was validated for different cell types, it is labor-intensive and time-consuming (requiring > 72h), limiting its suitability for routine use. More recently, Kim et al. described a method that separates exosomes and microvesicles using a combination of ultrafiltration (UF) and transverse flow field-flow fractionation (T4F) [37]. Although the T4F separation is achieved under 40 min, the preceding UF is time-consuming and introduces another level of complexity. Moreover, these methods face major challenges with regards to scale-up. Here, we introduce a rapid and low-cost method for enriching distinct EV subpopulations, thereby opening new avenues for characterizing the molecular content and studying subtype-specific function of different EV subpopulations. Our method enables the separation of EV subpopulations, defined by differences in chromatographic behavior based on relative hydrophobicity, from HEK293 clarified cell culture media in a total run time of 16 minutes, using PET C-CP fiber columns in both microbore and analytical scale formats. The repeatability and intermediate precision of the method in analytical scale column format (2.1 I.D.) enables sample enrichment for downstream characterization. The columns can be assembled within 10 minutes. Notably, the column hardware can be used infinitely (i.e., fibers can be replaced after appreciable decrease in respective peak area, typically after ~12 injections) which significantly reduces the overall cost of the column compared to packed bed HIC columns. To the best of our knowledge, there is yet a commercial column designed for HIC mode separation of EVs [38]. This study represents the first chromatographic method demonstrating the clean resolution of EV subpopulations. Note that this method is demonstrated for the single case of EVs isolated from HEK293 culture media. Other matrices need to be investigated to confirm the general applicability of the method, and this will be evaluated in future studies.
Perhaps the most important observation is that the different subpopulations elute in order of increasing size, which may suggest a secondary separation mechanism based on hydrodynamic size, though this is the opposite of a size exclusion chromatography (SEC) mechanism. However, the PET fibers do not have macropores, which rules out this possibility [39]. Theoretically, the number of membrane proteins, and thus vesicle hydrophobicity, increases relative to the EV surface area and volume. Therefore, we hypothesize that the elution trend is related to the surface hydrophobicity as reflected in the elution solvent compositions, where large EVs are more retained due to their relatively higher hydrophobicity. Moreover, the nFCM data shows that the first two peaks have closely similar population size range, thus these populations may likely differ more in surface composition rather than size. As such, the contribution of this mechanism cannot be completely ruled out.
Given the highly complex surface structure of EVs, it is unlikely that retention is driven by a single interaction mechanism. While hydrophobic interactions are expected to dominate under the experimental conditions used here, additional contributions such as electrostatic interactions and lipid-mediated van der Waals forces may influence retention behavior. Quantitative structure-retention relationships (QSRR) could be used to probe the separation mechanism by identifying the most informative structural descriptors and physicochemical properties associated with the different EV subpopulations [40]. A detailed mechanistic investigation of these contributions, however, is beyond the scope of this study. Nonetheless, comprehensive multi-omics analyses (lipidomics, proteomics, and glycomics) will be valuable for elucidating molecular differences between the subpopulations and will be the focus of future studies.
The existence of discrete-sized populations among the three fractions was verified via two independent mechanisms employing nFCM and NTA. The discrepancy in sizes between nFCM data and NTA may likely be due to a difference in detection mechanism or a difference in the sensitivity of the instruments. While nFCM requires < 108 particles mL-1 for optimum sensitivity, NTA requires > 108 particles mL-1 as both methods had been successfully validated based on manufacturer's guidance. Since the concentrations of the fractions were < 107 particles mL-1 (nFCM data), the NTA data might be slightly biased, resulting in the inclusion of sample artifacts and consequently inflating the true population size. We have observed a similar discrepancy in sizing between the two instruments, even for relatively “pure” samples such as silica nanoparticles [41]. Moreover, size discrepancies have also been reported for the same sample when using NTA instruments from different manufacturers [34]. This is a general bottleneck in the field: the lack of standardized reference materials and corresponding characterization methods [42].
Conclusions
Interest in extracellular vesicles has increased significantly over the last decade, with key advances across both fundamental and applied research. The potential of these bio-nanoparticle biomarkers and therapeutic vectors for human health is becoming well established. Yet, current separation methods do not provide the high resolution needed to separate heterogeneous populations of EVs, especially in the smaller size range (<200 nm), which slows down identification of size populations responsible for a desired effect, and consequently their full-scale translation. Promising results have been obtained with density gradient centrifugation and a combination of UF and T4F. However, these methods are time-consuming and not suitable for high-throughput routine applications.
To this end, we have developed a switchback gradient modulation strategy that selectively elutes distinct exosomal subpopulations defined by differences in chromatographic behaviour predominantly through their surface hydrophobicity, demonstrating the high-resolving capabilities of polyester C-CP fiber columns. The method allows enrichment of exosome subpopulations from HEK293 clarified culture media within a total run time of 16 minutes. The potential for routine application has been demonstrated, with high reproducibility across different sample and column batches, addressing another bottleneck in the field. Studies underway have improved the column load by (i) increasing the fiber packing density, (ii) introducing a void at the column inlet, which helps in premixing. This has substantially increased the column load, allowing injection of 4 µL of a 4X preconcentrated sample. This is currently used to isolate fractions for multi-omics analyses.
Future efforts will look to increase sample loading and reduce the need for multiple-injection pooling, requiring continued investigation of columns of larger format. Current loading capcities of ~1012 EVs per column in <15 process times will need to be augmented with the capability to achieve high loadings while retaining subpopulation resolution. This capability (and at higher capacities) will prove invaluable in terms of the tailoring of vector production processes. Additionally, it would also be worthwhile to assess the reproducibility of the downstream characterization data (size) from multiple independent preparations. Nonetheless, with the current format, this fast, cost-effective approach would be critical for providing the samples needed for routine biochemistry studies, multi-omics profiling, and ultimately, supporting biomarker discovery.
Abbreviations
EVs: extracellular vesicles; HIC: hydrophobic interaction chromatography; C-CP: capillary-channeled polymer; NTA: nanoparticle tracking analysis nano-flow cytometry (nFCM); TEM: transmission electron microscopy; HEK293: Human embryonic kidney-293; I.D.: internal diameter; MP: mobile phase; (U)HPLC: (Ultra)high performance liquid chromatography; UF: ultrafiltration; T4F: transverse flow field-flow fractionation; SEC: size exclusion chromatography; MCW: molecular weight cut-off; ACN: acetonitrile; PES: polyethersulfone; PEEK: polyether ether ketone; CCM: clarified culture medium; SSC: simultaneous side scatter.
Acknowledgements
This project was supported in part by the National Institutes of Health under grant 1RO1GM141347-01A1 and the National Science Foundation under grant CHE-2404088 and. This work used the JEOL 2100PLUS microscope housed in UGA's Georgia Electron Microscopy core facility, which was acquired with funding from the National Institutes of Health through grant 1S10OD034282-01. Raphael Ewonde Ewonde acknowledges the contributions of Stephanie Beitle for sample preparation and Carolina Mata for nFCM training, as well as funding through the Clemson Fellows program administered through the Clemson University Office of the Vice President of Research.
Author contributions
Raphael Ewonde Ewonde: Methodology, Data Curation, Visualization, Writing - Original Draft Preparation; William F. Pons: Methodology, Data Curation, Visualization; R. Kenneth Marcus: Funding Acquisition, Conceptualization, Supervision, Writing - Reviewing and Editing.
Competing Interests
The authors have declared that no competing interest exists.
References
1. Phillips W, Willms E, Hill AF. Understanding extracellular vesicle and nanoparticle heterogeneity: Novel methods and considerations. Proteomics. 2021;21:e2000118
2. Kim HI, Park J, Zhu Y, Wang X, Han Y, Zhang D. Recent advances in extracellular vesicles for therapeutic cargo delivery. Exp Mol Med. 2024;56:836-49
3. Farzanehpour M, Miri A, Alvanegh AG, Gouvarchinghaleh HE. Viral Vectors, Exosomes, and Vexosomes: Potential armamentarium for delivering CRISPR/Cas to cancer cells. Biochem Pharmacol. 2023;212:115555
4. Morad G, Carman CV, Hagedorn EJ, Perlin JR, Zon LI, Mustafaoglu N. et al. Tumor-Derived Extracellular Vesicles Breach the Intact Blood-Brain Barrier via Transcytosis. ACS Nano. 2019;13:13853-65
5. Kamerkar S, LeBleu VS, Sugimoto H, Yang S, Ruivo CF, Melo SA. et al. Exosomes facilitate therapeutic targeting of oncogenic KRAS in pancreatic cancer. Nature. 2017;546:498-503
6. Duan L, Xu L, Xu X, Qin Z, Zhou X, Xiao Y. et al. Exosome-mediated delivery of gene vectors for gene therapy. Nanoscale. 2021;13:1387-97
7. Li M, Zeringer E, Barta T, Schageman J, Cheng A, Vlassov AV. Analysis of the RNA content of the exosomes derived from blood serum and urine and its potential as biomarkers. Philos T Roy Soc B. 2014;369:20130502
8. Ferguson SW, Nguyen J. Exosomes as therapeutics: The implications of molecular composition and exosomal heterogeneity. J Control Release. 2016;228:179-90
9. Jing H, He X, Zheng J. Exosomes and regenerative medicine: state of the art and perspectives. Transl Res. 2018;196:1-16
10. Lässer C. Exosomes in diagnostic and therapeutic applications: biomarker, vaccine and RNA interference delivery vehicle. Expert Opin Biol Th. 2015;15:103-17
11. Willms E, Johansson HJ, Mäger I, Lee Y, Blomberg KEM, Sadik M. et al. Cells release subpopulations of exosomes with distinct molecular and biological properties. Sci Reports. 2016 6
12. Ahn SH, Ryu SW, Choi H, You S, Park J, Choi C. Manufacturing Therapeutic Exosomes: from Bench to Industry. Mol Cells. 2022;45:284-90
13. Kimiz-Gebologlu I, Oncel SS. Exosomes: Large-scale production, isolation, drug loading efficiency, and biodistribution and uptake. J Control Release. 2022 p. 533-43
14. Abaandou L, Quan D, Shiloach J. Affecting HEK293 Cell Growth and Production Performance by Modifying the Expression of Specific Genes. Cells. 2021 10
15. Allelein S, Medina-Perez P, Lopes ALH, Rau S, Hause G, Kölsch A. et al. Potential and challenges of specifically isolating extracellular vesicles from heterogeneous populations. Sci Reports. 2021 11
16. Crescitelli R, Lässer C, Lötvall J. Isolation and characterization of extracellular vesicle subpopulations from tissues. Nat Protoc. 2021;16:1548-80
17. Willms E, Cabañas C, Mäger I, Wood MJA, Vader P. Extracellular vesicle heterogeneity: Subpopulations, isolation techniques, and diverse functions in cancer progression. Front Immunol. 2018
18. Liangsupree T, Multia E, Riekkola M-L. Recent advances in modern extracellular vesicle isolation and separation techniques. J Chromatogr A. 2026;1767:466602
19. Carney RP, Mizenko RR, Bozkurt BT, Lowe N, Henson T, Arizzi A. et al. Harnessing extracellular vesicle heterogeneity for diagnostic and therapeutic applications. Nat Nanotechnol: Nature Research. 2025 p. 14-25
20. Mata C, Pimentel JM, Huang K, Stamatikos A, Marcus RK. Isolation of bovine milk-derived extracellular vesicles via a capillary-channeled polymer (C-CP) fiber stationary phase. Anal Bioanal Chem. 2025;417:2345-59
21. Pons WF, Marcus RK. Isolation of Urinary Extracellular Vesicles (EVs) via Hydrophobic Interaction Chromatography Using a Nylon-6 Capillary-Channeled Polymer (C-CP) Fiber Column. Journal of Separation Science. 2025;48:e70093
22. Jackson KK, Mata C, Marcus RK. A rapid capillary-channeled polymer (C-CP) fiber spin-down tip approach for the isolation of plant-derived extracellular vesicles (PDEVs) from 20 common fruit and vegetable sources. Talanta. 2023;252:123779
23. Jackson KK, Marcus RK. Rapid isolation and quantification of extracellular vesicles from suspension-adapted human embryonic kidney cells using capillary-channeled polymer fiber spin-down tips. Electrophoresis. 2023;44:190-202
24. Bin Islam MK, Marcus RK. Isolation and quantification of human urinary exosomes using a Tween-20 elution solvent from polyester, capillary-channeled polymer fiber columns. Anal Chim Acta. 2024;1329:343242
25. Wang L, Bruce TF, Huang S, Marcus RK. Isolation and quantitation of exosomes isolated from human plasma via hydrophobic interaction chromatography using a polyester, capillary-channeled polymer fiber phase. Anal Chim Acta. 2019;1082:186-93
26. Marcus RK, Mata C, Pons WF. EV Isolation from Diverse Matrices via Capillary-Channeled Polymer (C-CP) Fiber Platforms. In: Marcus RK, Lubman DM, editors. Exosomes and Extracellular Vesicles: Analytical Challenges and Biological Implications. New York: Springer Nature. 2025
27. Ewonde RE, Lingg N, Eßer D, Eeltink S. A protocol for setting-up robust hydrophobic interaction chromatography targeting the analysis of intact proteins and monoclonal antibodies. Anal Sci Adv. 2022;3:304-12
28. Stanelle RD, Mignanelli M, Brown P, Marcus RK. Capillary-channeled polymer (C-CP) fibers as a stationary phase in microbore high-performance liquid chromatography columns. Anal Bioanal Chem. 2006;384:250-8
29. Randunu JM, Marcus RK. Microbore Polypropylene Capillary Channeled Polymer (C-CP) Fiber Columns for Rapid Reversed Phase HPLC of Proteins. Anal Bioanal Chem. 2012;404:721-9
30. Huang S, Wang L, Bruce TF, Marcus RK. Evaluation of exosome loading characteristics in their purification via a <scp>glycerol-assisted</scp> hydrophobic interaction chromatography method on a polyester, <scp>capillary-channeled</scp> polymer fiber phase. Biotechnol Prog. 2020 36
31. Fekete S, Murisier A, Nguyen JM, Lauber MA, Guillarme D. Negative gradient slope methods to improve the separation of closely eluting proteins. J Chromatogr A. 2021;1635:461743 -
32. Kele M, Guiochon G. Repeatability and reproducibility of retention data and band profiles on reversed-phase liquid chromatography columns: IV. Results obtained with Luna C18 (2) columns. J Chromatogr A. 2000;869:181-209
33. Kowkabany G, Bao Y. Nanoparticle Tracking Analysis: An Effective Tool to Characterize Extracellular Vesicles. Molecules. 2024 29
34. Bachurski D, Schuldner M, Nguyen PH, Malz A, Reiners KS, Grenzi PC. et al. Extracellular vesicle measurements with nanoparticle tracking analysis - An accuracy and repeatability comparison between NanoSight NS300 and ZetaView. J Extracell Vesicles. 2019;8:1596016
35. Abhange K, King S, Peterson N, Sahai V, Cuneo KC, Lubman DM. The Use of dSTORM-Based Single Exosome Analysis To Study Tetraspanin Abundance in Extracellular Vesicles. ACS Omega. 2025;10:34659-65
36. Liu ZX, Chen G, Yu ZL. Advances in subpopulation separation and detection of extracellular vesicles: for liquid biopsy and downstream research. Theranostics. 2025;15:1135-55
37. Kim YB, Lee GB, Moon MH. Size Separation of Exosomes and Microvesicles Using Flow Field-Flow Fractionation/Multiangle Light Scattering and Lipidomic Comparison. Anal Chem. 2022;94:8958-65
38. Eeltink S, Ewonde RE, Papp D, Bui QD, Broeckhoven K, Scheich D. et al. The current state-of-the-art approaches and emerging opportunities for hydrophobic interaction chromatography for the characterization of intact proteins and biotherapeutics. J Chromatogr A: Elsevier B.V. 2025
39. Wang Z, Marcus RK. Determination of Pore Size Distributions in Capillary-Channeled Polymer Fiber Stationary Phases by Inverse Size Exclusion Chromatography (iSEC) and Implications for Fast Protein Separations. J Chromatogr A. 2014;1351:82-9
40. Amos RIJ, Haddad PR, Szucs R, Dolan JW, Pohl CA. Molecular modeling and prediction accuracy in Quantitative Structure-Retention Relationship calculations for chromatography. TrAC Trends in Analytical Chemistry. 2018;105:352-9
41. Pons WF, Joye KM, Bruce TF, Marcus RK. Comparison of light scattering-based detection methods for the sizing and number density characterization of extracellular vesicles (EV) isolated from human embryonic kidney (HEK) cell cultures. Anal Bioanal Chem. 2025 in press
42. Bordanaba-Florit G, Royo F, Kruglik SG, Falcón-Pérez JM. Using single-vesicle technologies to unravel the heterogeneity of extracellular vesicles. Nat Prot: Nature Research. 2021 p. 3163-85
Author contact
![]() Corresponding author: Prof. R. Kenneth Marcus, Department of Chemistry, Biosystems Research Complex, Clemson University, Clemson, SC 29634, USA; marcusredu; ORCID# 0000-0003-4276-5805.
Corresponding author: Prof. R. Kenneth Marcus, Department of Chemistry, Biosystems Research Complex, Clemson University, Clemson, SC 29634, USA; marcusredu; ORCID# 0000-0003-4276-5805.