- Volume 10; 2026
- Volume 9; 2025
- Volume 8; 2024
- Volume 7; 2023
- Volume 6; 2022
- Archive
- Editorial Board
- Cover Suggestion
- Index & Coverage
- Special Issues
Introduction
Application of AFM in blood...
AFM based studies on Diabetes...
AFM in anemia
AFM in blood diseases due to...
Conclusion
Abbreviations
References
International Journal of Biological Sciences
International Journal of Medical Sciences

 Global reach, higher impact
Nanotheranostics 2024; 8(3):330-343. doi:10.7150/ntno.93206 This issue Cite
Review
Characterizing morphological alterations in blood related disorders through Atomic Force Microscopy
Rohini Rakshak, Shweta Bhatt, Sushant Sharma, Rutesh Agharkar, Santosh Bodakhe, Rohit Srivastava ![]()
Department of Bioscience and Bioengineering, Indian Institute of Technology, Bombay, India.
Received 2023-12-13; Accepted 2024-1-25; Published 2024-3-25
Abstract

Atomic Force Microscopy (AFM) is a very flexible method that can create topographical images from a range of materials and image surfaces. Significantly, AFM has emerged as an invaluable tool for dissecting the morphology and biochemical aspects of body cells and tissues. The high-resolution imaging capabilities of AFM enable researchers to discern alterations in cell morphology and understand the underlying mechanisms of diseases. It contributes to understanding disease etiology and progression. In the context of this review, our focus will be directed towards elucidating the pivotal role of AFM in analysis of blood related disorders. Through detailed comparisons with normal cells, we delve into the alterations in size, shape, and surface characteristics induced by conditions such as cancer, diabetes, anaemia, and infections caused by pathogens. In essence, various work described in this article highlights to bridge the gap between traditional microscopy and in-depth analysis of blood-related pathologies, which in turn offers valuable perspectives for both research and clinical applications in the field.
Keywords: AFM, Blood related disorders, Cancer, Diabetes, Genetics, Anemia, Pathogens, Diagnosis, Therapy
Introduction
Currently various types of fatal blood related disorders are known, including pathogenic diseases, genetic disorders, diabetes, and certain types of cancers. For the development of therapy for such diseases, accurate diagnosis of the exact condition is essential. Imaging of the cells or tissues is commonly used to measure the size, surface area, and tissue properties [1], which is crucial to diagnose a specific disease or identify the drug design sites against that disease.
To visualize the disease inflicted cells or tissues that are affected in blood diseases, currently numerous imaging techniques are being used. Optical microscopy can be utilized to visualize blood smears, tissue smears or bone marrow smears. However, this microscopy requires the examiner to manually examine the sample, which may result in highly subjective conclusions with poor repeatability [2, 3]. Moreover, optical microscopy has its resolution limited to the wavelength of natural light. The maximum resolution achieved by optical microscopy is ~200 nm [4]. Similarly, confocal microscopy provides a good signal to noise ratio, but the image processing is extremely time consuming [5]. Fluorescence microscopy utilizes fluorescent molecules like Cy5, GFP (green fluorescent protein), or FlAsH (fluorescent arsenical helix binder) that are bound to probes which are then introduced to the cells using tools such as microinjection. These probes then bind to the cells to their target proteins and produce fluorescence when a certain wavelength of light is passed through them [6, 7]. Limited penetration, scattering of light due to tissues, photobleaching of dyes, and the limited amount of time the experiment can be run are the major drawbacks of fluorescence microscopy [8]. Detailed images of blood related cells or tissues can be provided using scanning electron microscopy (SEM) and transmission electron microscopy (TEM) which has a resolving power of ~5 nm [9]. TEM can however only produce two dimensional images black and white images [10]. Moreover, the cells need to be preserved in vacuum [3] which makes it unfit for in vivo imaging of blood diseases.
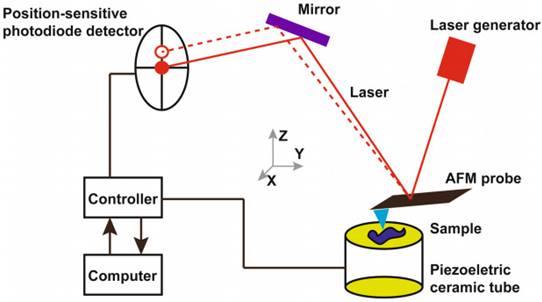
Atomic force microscopy (AFM) can prove to be a powerful tool to investigate blood samples. The structural changes in cells or tissues related to diseases can be identified using the AFM [11, 12]. The interactions between AFM probe and the surface of the sample produces topographic images. The AFM probe scans the surface of the sample while the cantilever of the probe moves perpendicularly according to the interatomic potentials between the sample and the tip of the cantilever. The cantilever's perpendicular movements dictate the topographic images of the sample surface [13, 14]. AFM is advantageous as it allows the imaging of the cells in their natural conditions such as in buffer solutions, in situ, and in vitro. The sample preparation is easy, and the high signal-to-noise ratio of AFM allows topological imaging with resolution of upto 0.5-1 nm (lateral resolution) and 0.1 - 0.2 nm (vertical resolution) [15-17].
Working principle of atomic force microscopy. Reproduced with permission from Springer 2018 [36].
Biochemical assays and spectroscopic tools for biomarker identification are disadvantageous as they tend to have low sensitivity, require large amount of samples, and are time consuming and are expensive [18-21]. The structural and compositional changes in the cells or tissues are common characteristics of several diseases which can be utilized as a biomarker by AFM [22-25].
Another added advantage of AFM is the measurement of stiffness and elasticity using Young's modulus (E) [26]. For blood cells like red blood cells (RBCs), change in membrane stiffness or elasticity can be identified with the AFM which is otherwise not present in other imaging techniques which makes it an ideal choice for investigating blood related samples [27]. Studies have shown that pathological erythrocytes have a higher Young's modulus than normal erythrocytes [28]. Sample collection for analysis via AFM is simple and only requires blood samples or tissue surgical specimens from patients, as well as from healthy volunteers for control [29].
AFM also allows the measurement of membrane surface roughness. The surface roughness is commonly measured as root mean squared roughness (Rrms) or average roughness (Ra) [30]. The decrease in membrane roughness for the likes of erythrocytes might indicate a pathological sample [31-33]. The roughness on the cell surface can hint the presence and size of biomolecules like protein or polysaccharides, which is otherwise not possible in light microscopy. The roughness can also indicate the changes of the cell surface structures, which can be combined with other macroscopic observations to diagnose a condition [34, 35].
Diseases such as diabetes, anaemia, malaria, hereditary spherocytosis (HS), and blood cancers which directly affects the erythrocytes, leukocytes and other blood corpuscles have already been studied using AFM where structurally and functionally abnormal blood components were observed. In this review, investigations done by AFM in blood related disorders is highlighted, and the potential for AFM to be used in diagnosis of these diseases in the future is focused.
Application of AFM in blood cancers
AFM has been used to image tumour cells or tissue, specifically in different blood cancers. AFM examinations of leukocytes in leukemia patients have shown a significant increase in the number of needle-like features on their surface with an increase in surface roughness than that of healthy white blood cells. Additionally, when comparing normal cells to tumour cells from the same source, AFM could identify if the cells are malignant or no and show the notable differences in cell membrane shape between the two types of cells. This can offer a trustworthy supplementary foundation for differential and clinical pathological diagnosis. Similar abnormal observations along with some common types of blood cancer, have been studied and highlighted in this section [36].
The noticeable cytoskeletal changes, in AFM indentation measurements have revealed that cancer cells are typically softer than healthy ones. On the other hand, cancer tissues seem to be considerably stiffer than healthy cells. This is because of an overabundance of extracellular matrix proteins that are stiff, like collagen, fibronectin, and laminin.
The intricate interaction between cells and their extracellular matrix (ECM), which controls biochemical reactions and essential cellular functions, is upset by these alterations to the mechanical equilibrium. AFM is a quantitative technology that has the potential of integration with a traditional histological investigation of surgically removed tissues in this particular situation [37].
Chronic myeloid leukemia
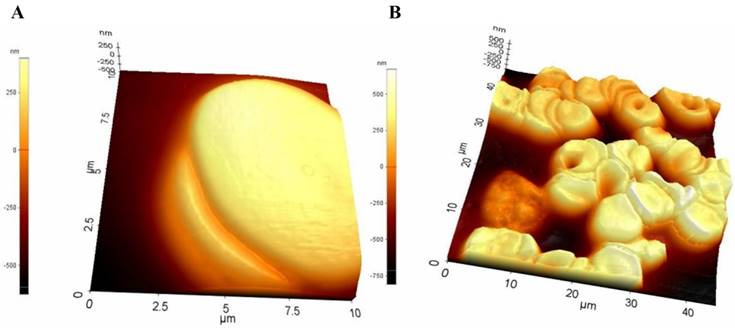
Chronic myeloid leukemia (CML) is a type of cancer that starts in certain blood-forming cells of the bone marrow. An abnormal gene called BCR-ABL, turns a normal cell into CML cell. CML is a fairly slow growing leukemia, but it can change into a fast-growing acute leukemia that is hard to treat. A study was conducted on nine patients with chronic myeloid leukemia in varying stages of the disease—three in the chronic phase, three in the accelerated phase, three in the blastic phase. As a control three healthy human subjects had their bone marrow taken. The morphology of the cells was examined using non-contact mode of AFM. The scan resonant frequency was 1.7 kHz with a Z scan range of 25 μm. The height of normal cells was observed within the range of 10-15 micrometres (µm), whereas CML cells were consistently observed showing multiple spicules on the cell surface ranging from 25-30 micrometres (µm) showing a significant difference of roughness between normal cells and leukemic cell (Figure 2) [38].
Surface morphology of leukocytes (A) from healthy individuals (B) from chronic leukaemia patients obtained using AFM. Reproduced with permission from Medical University Publishing House Craiova 2013 [38].
Myeloma
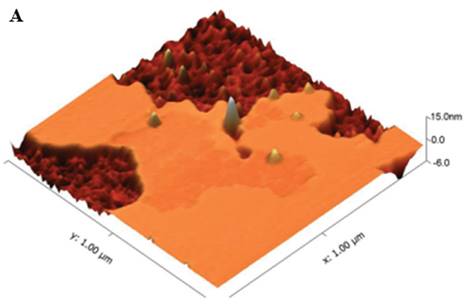
The haematological cancer myeloma or multiple myeloma (MM) is caused by clonal plasma cells in the bone marrow. Free immunoglobulin light chains (FLCs), are secreted by MM plasma cells and are a predictive indicator of illness [39, 40]. λFLCs (lambda free immunoglobulin chains) is one such type of FLC which was thoroughly studied using the AFM in MM cells. In the study, to visualise λFLCs, 30 μg/ml of λFLC was put into recently broken mica and left for 30 minutes. The mica was then washed with TBS. After the mica surface was cleaned, the sample was added to 250 μg/ml λFLC or a protein-free control, and it was left to incubate for one to two hours. Using AFM, the sample was imaged in a liquid cell using tapping mode. An E-type scanner with a maximum scan area of 12.5 μm2 and a vertical range of 3.4 μm was employed for the imaging process (Figure 3) [41]. In the study, it was concluded that at the cell surfaces of multiple myeloma aggregated alpha light chains which were due to overexpression of genes typical in cancer. Furthermore, these chains were interacting zwitter-ionically with transport molecules across the cell membrane. These transport molecules were acting as recognition sites for cargo delivery, enhancing cancer cell life [41].
Leukocyte surface from chronic leukemia individual with protruding λFLC visualized using AFM. Reproduced with permission from Biochemical Society 2013 [41].
In another study the extracellular vesicles from bone marrow cells, were studied from two groups of patients: healthy and multiple myeloma. It was observed that, based on Young's moduli values, multiple myeloma cells were significantly smaller than healthy cells. The multiple myeloma altered the structure of these vesicles, making them elastic from their healthy counterparts. These elastic bodies would be assisting myelomas to flourish within patient body [42].
AFM studies of similar manner also paved way for novel formulations like Rituzimab, Truxima, Ruxience, and Rixathon for therapeutic application for multiple myeloma and lymphoma [43].
AFM based studies on Diabetes Induced Alterations
Type 2 diabetes mellitus (T2DM) disrupts architecture and functionality of numerous bio-physiological elements at a molecular scale. Diabetes being a complex disorder has driven researchers to explore its impact at atomic-level. In this section, we delve into significant studies made possible through AFM in elucidating the intricate morphological changes within body cells, tissues and fluids associated with diabetes.
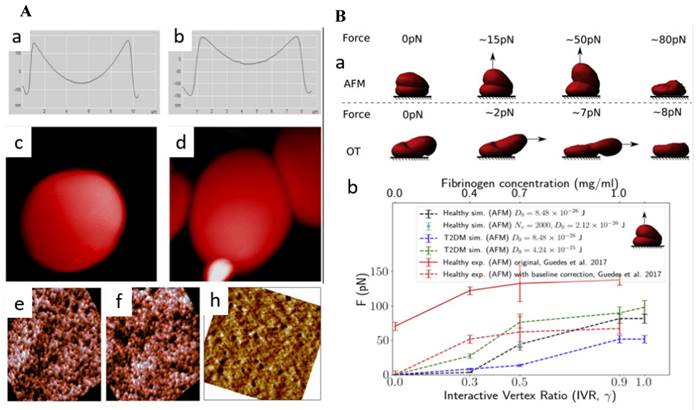
Using AFM, researchers were able to examine subtle changes in the morphology of erythrocytes, such as their height, axial ratio, concave depth, and thickness. A study revealed how individuals with prediabetes and diabetes exhibit alterations in erythrocyte morphology and how glycated hemoglobin (HbA1c) might have a significant role in altered morphology. [44]. AlSalhi et al. revealed the presence of subtle surface irregularities in the erythrocytes of individuals with prediabetes and diabetes, such as mild pits and blowholes. Notably, diabetic patients exhibited a balloon-like structure in the RBCs. Another significant finding was the tendency of these cells to adhere to one another, forming clusters (Figure 4A) [45]. Fibrinogen, a key glycoprotein in the clustering of RBCs, is naturally occurring process that has significant implications on rheology of blood and blood flow. It plays crucial role in type 2 diabetes mellitus (T2DM). Deng et al., used AFM to quantify, fibrinogen-dependent clumping of RBCs in T2DM patients by a predictive computerized simulator. To begin simulations, one RBC was placed on top of another to make a doublet. The top RBC was gradually dragged away from the bottom RBC until the doublet separated completely. The applied force was then correlated with the concentration of fibrinogen (Figure 4B) [46].
(A) Geometrical characteristics of (a) healthy RBC and (b) pre-diabetic erythrocyte. Distinct, balloon-like structure of the RBC of the diabetic patient (c) clinging and (d) adhering of cells among themselves. Erythrocyte cell membrane AFM images of (e) healthy (f) pre-diabetic and (h) diabetic (Scan size is 900 × 900 nm). Reproduced with permission from MDPI 2018 [45]. (B) (a) Simulations of increasing force exerted on the top of healthy doublet (b) critical force positively correlated with interactive vertex ratio. This corresponds to the fibrinogen concentration level. Reproduced with permission from Cell Press 2020 [46].
Alexandrova et al. investigated the morphological parameters of human leukocytes in T2DM using the tapping mode. In comparison to the healthy donors, the diameter of leukocytes and Young's modulus was found to be increased significantly, although cell height reduced. Thus, white blood cells (WBCs) from diabetic patients were found to be stiffer than leukocytes from healthy donors. A number of spherical prominences and depressions changed significantly indicating influence of diabetes WBCs malformation [47]. Another study also found a similar change in WBC stiffness. Young's modulus was found to be raised by 73% in diabetes patients, which is roughly 3.7 times greater than in healthy individuals, as demonstrated by AFM scans of WBC cytolemma surfaces [48].
In addition to erythrocytes and leukocytes, AFM has been employed to investigate a range of tissues, bodily fluids, and other constituents of blood. The findings of these investigations have been summarized in Table 1, covering several key parameters derived from the study of these biological elements.
A summary of studies utilizing Atomic Force Microscopy (AFM) to investigate the effects of diabetes on different types of body cells and various bodily fluids.
| Type | Physiological Element | AFM Technique used | Sample preparation | Morphological Parameters | Specifications/Observations ** | References |
|---|---|---|---|---|---|---|
| Cell components | Erythrocyte | Tapping Mode Cantilever thickness: 7 μm, Length: 225 μm, width 38 μm, Resonance frequency: 190 kHz, Force constant: 48 N/m, Al-coating | Erythrocytes pellet was fixed in glutaraldehyde (2.5 % in H2O), and washed 3X with 0.2 M PBS, a drop was added on silicon oxide (300 nm). Air dried | Pre-diabetic | [44] | |
| Height | -0.80 μm | |||||
| Axial ratio | -0.09 μm | |||||
| Diabetes Mellitus | ||||||
| Height | -0.46 μm | |||||
| Concave depth | -0.29 μm | |||||
| Axial ratio | +0.08 μm | |||||
| Thickness | +0.32 μm | |||||
| Erythrocyte | Spring constant: 20-80 N/m. Tip radius 8 nm Resonant frequency: 342-394 KHz | Erythrocytes mixed with Acetone (Spectroscopic grade) | Pre-diabetic | [45] | ||
| Diameter | -1.26 μm | |||||
| Concave depth | -154.1 nm | |||||
| Roughness | -0.02 nm | |||||
| Diabetic | ||||||
| Diameter | +0.89 μm | |||||
| Concave depth | Concave | |||||
| Roughness | +0.11 | |||||
| Erythrocyte | RBCs were resuspended in autologous plasma after blood was centrifuged, resulting in a 2-2.3% hematocrit. | The force required for cell-cell separation was measured by placing the AFM tip above the RBC core, which creates an upward pull in a vertical direction. Vertex fraction, Force required was calculated. | Critical Force (F) Vertex Ratio | F was found to be higher than healthy ones. F is favourably related to the level of fibrinogen concentration and increases with the interactive vertex ratio g. | [46] | |
| Leukocyte | Tapping mode with scanning probe microscope (scan frequency 0.6-0.8 Hz), tip radius curvature: 10 nm | Leukocyte ring collected after centrifuge was re-suspended in RPMI-1640 | T2DM | [47] | ||
| Diameter | +7.5% | |||||
| Height | +13.1% | |||||
| Young's Modulus (E) | +23.7% | |||||
| Globular prominences and depressions | +6.1% | |||||
| Leukocyte | Contact Mode in aqueous solution. Scanning performed: silicon probe Stiffness: 0.06 N/m radius curvature: 10 nm. | Separated lymphocytes cultured in Hank's medium for 20 min. Medium changed to: Medium 199 for 60 min | Insulin-dependent | [48] | ||
| Diameter | +0.3 μm | |||||
| Height | -0.36 μm | |||||
| Young's Modulus | +0.41 MPa | |||||
| Adhesion | +3.51 nN | |||||
| Roughness (Sa) | -39.96 nm | |||||
| Non-insulin dependent | ||||||
| Diameter | -1.79 μm | |||||
| Height | -0.18 μm | |||||
| Young's Modulus | +0.38 MPa | |||||
| Adhesion | -1.32 nN | |||||
| Roughness | -48.14 nm | |||||
| Cardiomyocytes | Tapping Mode Tip radius: 2nm | TyBS (1.8 mM Ca2+ or 200 μM Ca2+) treated cells plated on polylysine-coated glass micro slide chambers (10 min). Attached cells + Propidium Iodide (5 min, dark), 3X washes: TyBS with different ionic compositions | Height | +0.7% | [49] | |
| Apparent Elastic Modulus | +112% | |||||
| Adhesive Force | +10.5 X | |||||
| Tissue | Adipose | Contacting and intending k ~ 0.035 N/m frequency: 17 kHz tip radius: 10 nm | Subcutaneous and visceral fat were extracted from the abdomen wall and the larger omentum. These were divided into pieces and placed on coverslips coated with polylysine. | Mean Elastic Modulus | +7.02 kPa | [50] |
| Other body components | Ocular basement membranes. Tip Radius: 6 nm | Nominal Spring constant 0.081 N/m | Inner limiting membranes (ILM) coated with 10 μg/ml polylysine | Thickness of ILM | Increased | [51] |
| Stiffness | Increased | |||||
| Achilles Tendon | Both contact and tapping modes Atrractive force of 0.01 nN Tip radius: 15 nm | Sample collection from Rattus norvegicus. | Coronal Plane Area Dimesions | +3.76 mm2 | [52] | |
| Size of Transverse section area | +0.388 mm2 | |||||
| Body fluids | Tear fluid | Tapping mode Radius of curvature: 10 nm | Tear samples collected by flushing method using saline solution. | Dendrites (on 1-year treatment with insulin and anti-diabetic drug) | Dense network observed. | [53] |
| Surface roughness | 19 nm | |||||
| Clot formations | Tip radius: 8 nm Resonance frequency: 75 kHz Spring constant: 3 N/m | Peripheral blood was obtained. 2% CaCl2 added to initiate coagulation. | Morphology: | [54] | ||
| Erythrocyte | Poikilocytosis Anisocytosis | |||||
| Leukocyte | Irregular surface with extended pseudopodia |
** - (Minus)/+ (Plus): Decrease/Increase observed in parameter with respect to normal cell.
AFM in anemia
AFM has been utilized to investigate the morphological alterations in blood corpuscles, specifically erythrocytes, caused due to genetic conditions. Some of these well-studied cases recorded in the literature are discussed in this section.
Genetic-alteration based anemia
Sickle cell anemia
Unexpectedly low amount of erythrocyte or hemoglobin in the blood is referred to as anemia. Erythrocyte shape disfigurement is another common observation in anemic conditions [55]. Sickle cell anemia is a type of anemia that is caused because of point mutation in β-globin gene. It is a recessively inherited gene and causes the production of abnormal (sickle shaped) hemoglobin [56-58], which in turn results in malformed RBC production-sickle shaped instead of normal biconcave. Sickle shaped RBCs (SSRBCs) have lower flexibility, high adhesiveness to the endothelium, as well as other blood corpuscles (RBCs, leukocytes and platelets), and an increased viscosity than wild type (WT) RBCs [56, 59-63].
In a study, determination of the stiffness of anomalous erythrocytes was done using AFM with blood samples collected from known sickle cell anemia patients [64]. Comparison of the Young's modulus obtained from the anemic erythrocytes was done against the Young's modulus of the erythrocytes of healthy patients. Young's modulus of the anemic RBCs was 3.05 ±1.09 kPa, which was significantly higher than the normal cells whose Young's modulus was 1.10 ± 0.40 kPa. Young's modulus is a direct measure of stiffness. The increase in erythrocyte stiffness in sickle cell anemia is hypothesized to be due to the affinity of actin filament with spectrin filament which is caused by the abnormal hemoglobin HbS.
Thalassemia
Thalassemia is a genetic condition where the shape of the erythrocytes is disfigured due to the abnormal α or β chain of hemoglobin, which in turn causes cytoskeletal changes [65]. Thalassemia is phenotypically similar to some types of anemia like iron deficiency anemia (IDA). Thus, a proper distinction between the two types of diseases becomes extremely vital for their treatment.
In a study [66], AFM was employed to distinguish the length, width, length-width ratio, valley, peak, valley-peak ratio, standard deviation and surface fluctuation of normal healthy erythrocytes, IDA erythrocytes, and THAL (thalassemic erythrocytes). AFM topographic data of the erythrocytes showed a distinction between all three types. The ratio of length-width for IDA was found to be 1.55 ± 0.42 which signified a more oval cell shape, whereas compared to THAL whose length-width ratio was 1.06 ± 0.34. Another important observation was the size of the membrane particles. Healthy cells had the membrane particles of 8 nm whereas anemic cells had the membrane particle size of 140 nm. This suggested that membrane proteins aggregated on the erythrocyte surface. The THAL on the other hand had holes and creviced ultrastructures on the cell surface strongly suggesting the damage of membrane skeleton of erythrocytes [67].
Glucose-6-phosphate-dehydrogenase (G6PD) deficiency anemia
Defects in the gene coding for glucose-6-phosphate-dehydrogenase (G6PD) is a hereditary disorder which can cause defective G6PD or complete absence of G6PD. This in turn results in hemolytic anemia. These anemias have a wide range of symptoms ranging from being extremely severe, to being asymptomatic [68, 69]
In a study [70], AFM was employed in a tapping mode to obtain the ultrastructures of G6PD deficient erythrocyte and normal erythrocytes. The cantilever had thickness, width and length of 0.3, 32, and 30 µm respectively, along with 400 kHz oscillation frequency and 4 N/m of constant force. Imaging of the cells were done in air at 256 x 256 pixels and a 1.95 Hz scan speed. 33 different G6PD deficient individuals were chosen for the test and on genetic testing, 9 types of mutations were observed-7 missense, 1 same sense, and 1 intron variant. Using statistical tools incorporated with AFM, a difference in roughness of the membrane was observed in membrane of all types of mutants. G6PD deficient erythrocytes were significantly rough than the normal erythrocytes.
Hereditary Spherocytosis (HS) refers to a disorder where the erythrocytes are spherical instead of the normal biconcave. The symptoms of this disorder include anemia, splenomegaly, jaundice, hemolysis, and even growth retardation. Mutations of genes coding for proteins of the erythrocyte membrane as well as cytoskeletal proteins such as α- and β-spectrin, ankyrin or protein 4.1 cause hereditary spherocytosis [71]. This causes the membrane to take up the lowest volume structure-a sphere [72]. Diagnosis of this disorder is normally done by flow cytometry, light microscopy or electron microscopy [73]. However, the major limitation of these methods is the lack of measurements in the z-axis. AFM can be utilized to overcome this challenge [74].
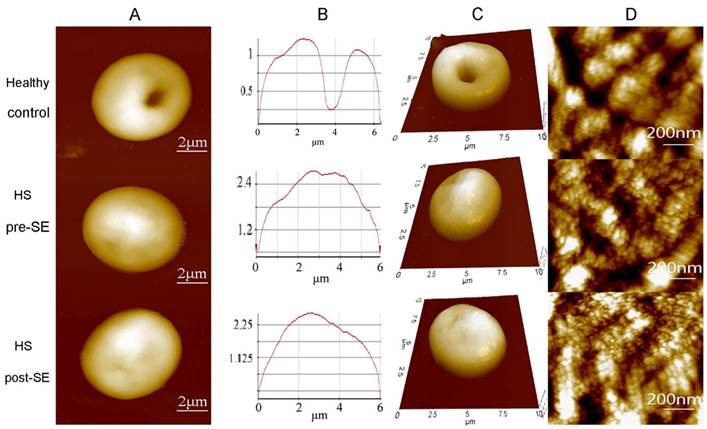
A study conducted utilized tapping mode of AFM in air to obtain the topographic images of the RBC samples [75]. The topographic images obtained for the samples showed a distinctive spherical structure of the erythrocytes. The surface roughness (Ra) was significantly reduced in the HS erythrocytes (215.67 ± 6.11 nm) than in the normal erythrocytes (287.00 ± 44.03 nm). The patients underwent splenectomy after the initial test and their erythrocytes were re-examined after 3 months using AFM. There was no change in the shape of erythrocytes shape after splenectomy, however there was a slight increase in their sizes. The compared AFM images are given in Figure 5.
Compared AFM topographic images from healthy individuals, HS individuals pre-splenectomy, and HS individuals post-splenectomy. (A) single erythrocytes, (B) height profile of the same erythrocyte (C) 3D model of the same erythrocyte (D) Surface ultrastructures of the corresponding erythrocytes. Scan area: (A, B, and C) 10 µm x 10 µm; (D) 1 µm x 1 µm. Reproduced with permission from Springer 2016 [75].
In another study [76], AFM was employed as well to discriminate normal erythrocytes from HS erythrocytes. Lateral force maps were obtained by quantitating the torsion value of the cantilever and then representing them in arbitrary units. These lateral force maps were then used to measure the median sliding force (Ff) and root mean square roughness (Rq). The AFM probes enabled force spectroscopy, with which the Young's modulus was obtained. The Young's modulus and average friction forces were ~ 20% higher in the HS surface regions than in the surface of the discocytes.
Hemochromatosis
Transferrin receptor 2 (TfR2) is a counterpart of the conventional transferrin receptor 1 (TfR1). TfR2 exists in two forms, namely, α and β isoforms. TfR2α, which binds diferric transferrin (Tf), is implicated in cellular iron metabolism. Mutations in TfR2 are associated with hemochromatosis, indicating its role in regulating iron levels. This interaction was confirmed using AFM. TfRα, located on the cell surface, acts as an essential iron donator by binding to transferrin (Tf) and facilitating the delivery of iron to the cells [77].
A summary of studies utilizing Atomic Force Microscopy (AFM) to investigate the effects of anemia on erythrocytes.
| Disorder studied using AFM | Physiological Element | AFM technique used | Sample preparation | Morphological parameters | Specifications/Observations | References |
|---|---|---|---|---|---|---|
| Sickle cell anemia | Erythrocyte | Non-contact; scan rate 0.2 Hz; probes with 0.01 N/m spring constant. | AFM grade mica was coated with poly-L-lysine; 5.0% RBCs in PBS were allowed to adhere to the mica. Fixation of cells was done using 0.5% glutaraldehyde, followed by washing with PBS. | Young's modulus | +1.95 kPa | [64] |
| Thalassemia | Erythrocyte | Contact mode; 255 kHz oscillation frequency; 0.03 N/m force constant; 2.5 N/m spring constant. | RBCs were fixed using 2.5% paraformaldehyde, and diluted in PBS. Sample was air dried. | Length-to-width ratio | +0.04 | [67] |
| Peak-valley distance | -749.14 nm | |||||
| Ra | -213.58 nm | |||||
| G6PD deficiency anemia | Erythrocyte | Tapping mode; 400 kHz oscillation frequency; 4 N/m force constant; 1.95 Hz scan speed. | RBCs were washed with PBS and them deposited on mica. Using a fast stream of PBS through a needle at 20° angle, RBCs were sheared open and the membrane was obtained. | Ra | Increased | [70] |
| Hereditary spherocytosis | Erythrocyte | Tapping mode; 2.5 N/m spring constant. | Blood was centrifuged and the pellet was resuspended in PBS. The suspension was fixed on a coverslip with 1% glutaraldehyde, followed by washing using deionized water. | Length | -0.59 µm | [75] |
| Width | -0.41 µm | |||||
| Peak-valley distance | -214.5 nm | |||||
| Hereditary spherocytosis | Erythrocyte | 0.6-0.7 Hz scanning rate. | RBC resuspension was fixed using 1% glutaraldehyde. | Relative friction force | +0.19 | [76] |
| Relative RMS roughness | -0.2 | |||||
| Young's Modulus | +0.19 | |||||
| Folate Deficiency | Erythrocyte | Contact mode, tip diameter 20 nm, coefficient of tip 2.5 N/m | Blood was withdrawn from patients with MA. Erythrocytes were separated and fixed on a glass slide. | Size | + | [79] |
| Altitude | - | |||||
| Average roughness | - | |||||
| Rp-v | - | |||||
| Surface area | - | |||||
| Iron Deficiency | Erythrocyte | Contact mode; 287-336 kHz oscillation frequency; 28-45 N/m force constant. | Cells were fixed using 2.5% paraformaldehyde. | Topographical information | Crenated Shape Smaller size of RBC Large holes (abnormal hemoglobin) | [81] |
** - (Minus)/+ (Plus): Decrease/Increase observed in parameter with respect to normal cell.
Nutritional deficiency-based anemia
Folate deficiency
A study revealed how deficiency of folate is one of the main causes of megaloblastic anemia (MA) [78]. Through AFM it was found that the erythrocytes of the patients exhibited greater size compared to those of the healthy controls, yet their altitude, average roughness, Rp-v and surface area was lower in comparison to the controls [79].
Iron deficiency anemia
Iron deficiency anemia (IDA) is a worldwide prevailing condition caused due to the reduced intake of iron through diet, bleeding due to injury, loss of blood due to menstruation, or gastrointestinal bleeding [80]. In a study AFM was employed to obtain the topographic images of IDA erythrocytes [81]. In comparison to the RBCs of healthy patient and even thalassemic RBCs, the IDA erythrocytes showed higher deformities and irregularities in morphology. The cells were oval and more swelling was observed at the centre of the RBCs.
AFM in blood diseases due to pathogens
The AFM technology has the potential to be used for screening newly emerging pathogens. It is useful for pathogen research since it offers a quick, easy, and secure method for characterizing viruses with minimal and comparatively unrefined preparation. Several blood diseases caused by microbes that have been studied using AFM are listed in this section.
Dengue
Dengue is a mosquito-borne flavivirus that poses a significant threat to global public health [82]. Platelet dysfunction and thrombocytopenia are significant hematopathologic characteristics of dengue fever [83, 84]. A study utilized tapping and contact mode of AFM to investigate the impact of viral infections on platelets. Morphological changes were observed in human blood platelets following exposure to the dengue-2 virus. The study concluded that exposure to dengue-2 virus at concentrations similar to those found in naturally occurring viremic stages in human infections can stimulate platelets by increasing their production of P-selectin and their ability to bind fibrinogen [85].
COVID-19
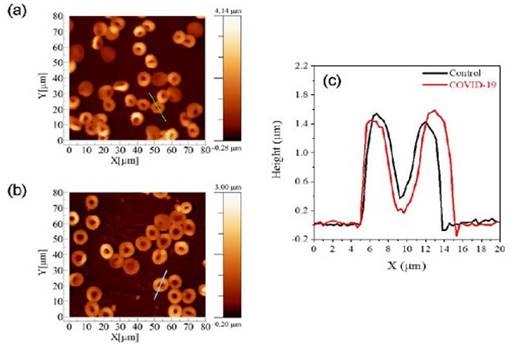
Human erythrocytes are harmed structurally, functionally, and morphologically by SARS-CoV-2 [86]. In order to examine changes in structural and biomechanical features by AFM, tapping mode was employed to image erythrocytes from control and COVID-19 affected groups in a study. Utilizing a typical AFM setup with a combined optical microscope, the cellular morphology images and elasticity data were acquired. This combination allowed AFM to be positioned laterally and tip over the cell's nuclear area with micrometer-scale accuracy. The acquired images are given in Figure 6. Young's modulus of COVID-19-affected-RBCs were than normal RBCs which the authors hypothesize to be due to membrane alterations that cause the membranes to stiffen. The average RBC measurements for control volunteers were 8.92 ± 0.73 μm for diameter and 1.27 ± 0.11 μm for height. In contrast, the RBC measurements for COVID-19 patients showed 10.41 ± 0.78 μm for diameter and 0.98 ± 0.07 μm for height [87].
AFM images of erythrocytes of (a) control and (b) COVID-19 affected cells. (c) Distribution of the cells concerning the parameter of diameter and height for both diameter and height. (d) Box plots of the diameter of cell. Reproduced with permission from SciELO 2023 [87].
Malaria
One of the major problems during malaria infection is the attachment of infected RBCs (iRBCs) to the arterioles, capillaries and venules, collectively called as microvasculature walls. A study developed an advanced flow-based adhesion assay to demonstrate the adhesion of iRBCs to endothelial CD36 receptor protein. Adhesion receptor and ligand binding kinetics were analyzed using AFM [88]. AFM was also used to investigate how knobs arise and how they interact with the spectrin network of the host cell. P. falciparum erythrocyte membrane protein 1 (PfEMP1) and knob associated histidine-rich protein (KHARP) are two examples of parasite-expressed proteins that are exported by the parasites to the host cell membrane during the maturation process. These proteins formed knobs on the host cell surface, stiffen the membrane, and induce cytoadherence, or cell stickiness. Both the extracellular and cytoplasmic surfaces of infected erythrocyte membranes were examined using AFM. The cytoplasmic surface AFM pictures revealed additional information about the spectrin network. On the cytoplasmic surface of infected erythrocytes, knobs and their links or connections to the spectrin network were readily visible. Knobs seen from the cytoplasmic surface resembled those seen from the extracellular surface in terms of size and distribution. Moreover, significant alterations in the spectrin network were observed subsequent to infection; that is, a partial disruption of the spectrin network during the schizont stage [89].
HIV
Hu, M. et al, recognized that CD4+ T cells are essential for the immune regulation of numerous viral diseases, including HIV-1. This study describes the use of AFM-based single-molecule force spectroscopy to measure the morphological changes and particular binding forces between the CD4 antibody and its receptor. One CD4+ T cell that was activated and one resting cell were used for the measurements. Topographic images were obtained using a contact mode. For force detection, AFM-based force spectroscopy was employed. Conventional retraction was used to create force-distance curves. Every force-distance curve experiment was carried out at an identical loading rate [90].
Exosomes are external membrane vesicles (EV) at the nanoscale that are important in signalling and communication between cells. These are a potentially useful technique for drug delivery in biomedicine. Himbert S. et al, investigated the biomechanical characteristics of both kinds of particles in liquid and air using the atomic force microscope technology. Bruker's Bioscope Catalyst and Bioscope Resolve microscopes in PeakForce QNM mode were used to do the measurements in both liquid and air [91].
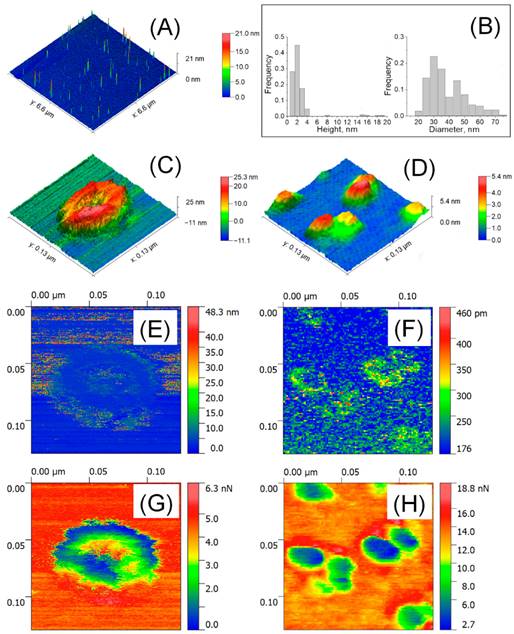
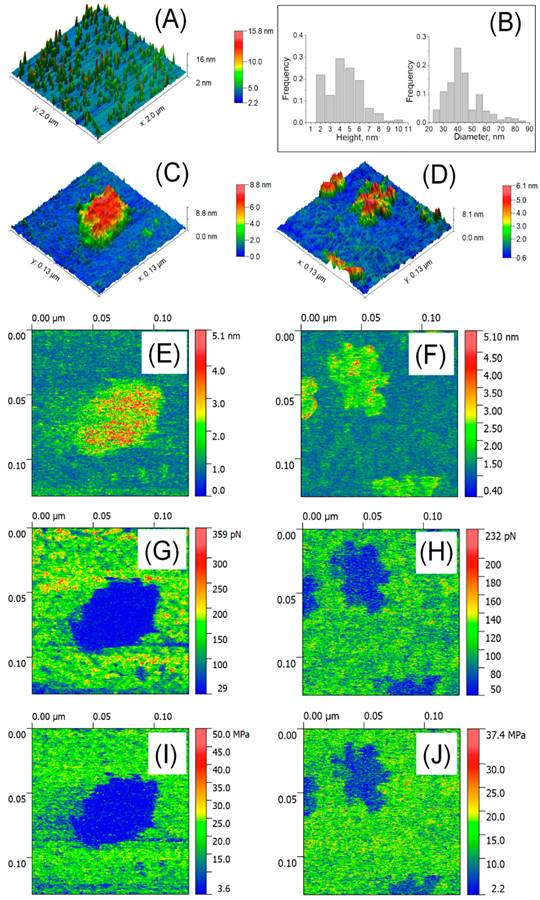
Atomic force microscopy (AFM) was used to analyze isolated blood plasma vesicles at the single particle level in both liquid and air. These vesicles carried biomarkers linked to exosomes and exomeres. Exosome tests in the air showed the presence of highly sticky spots within a mechanically depressed interior cavity. On the other hand, the particles' measured diameter was about 35 nm, and the highly sticky exomere sites were situated in their periphery. The internal chamber of exosomes exhibited reversible deformation in liquid state, and a slightly distorted lipid bi-layer was detected. On the other hand, exomeres had an observed diameter of around 16 nm and were not distorted. A stronger sorption of water film in the air could be linked to the differences in diameters (Figure 7, Figure 8) [92].
Detection of EV by AFM in air. (A) 6.6 × 6.6 μm2 large scaled AFM image. (B) Distribution of size; (C) High resolution AFM image of a single exosome (129 × 129 nm2) and (D) single exomeres; (E, F) Deformation; (G, H) adhesion forces. Reproduced with permission from MDPI 2020 [90].
Detection of EVs in liquid using AFM. (A) 2 x 2 µm2 image; (B) Distribution of size (n=207-254); (C) High resolution image of a single exosome (129 x 129 nm2); (D) Aggregates of single exomere; (E, F) Parameters of deformation; (G, H) Forces of adhesion; (I, J) Young's modulus. Reproduced with permission from MDPI 2020 [90].
A summary of studies utilizing Atomic Force Microscopy (AFM) to investigate the effects of pathogens on blood components.
| Disease | Physiological Elements | AFM Technique used | Sample preparation | Morphological Parameter | Specification/Observation | References |
|---|---|---|---|---|---|---|
| Dengue | Platelets | Tapping mode, contact mode | Blood platelets were washed and then exposed to dengue-2-virus before being imaged | Surface changes | Filopodia-like extension and micropitting present | [85] |
| COVID-19 | Erythrocytes | Tapping mode, force-curve based imaging mode | Muscovite mica sheets were adhered to a glass slide, coated with 0.1% poly-L-lysine for 10 mins at 20 °C, rinsed with 3 ml of buffer A (10 mM Tris-HCl pH 7.5 and 100 mM NaCl), and then dried using an N2 flux. | Diameter | 10.41 ± 0.78 µm | [87] |
| Height | 0.98 ± 0.07 μm | |||||
| Average RBC measurement | ||||||
| Diameter | 8.92 ± 0.73 μm | |||||
| Height | 1.27 ± 0.11 μm | |||||
| HIV | Extracellular vesicles | Contact mode | For air measurements: 10 µl of the investigated solution was diluted 100 times. Following a five-minute incubation period, it was washed with deionized water and dried. | Diameter | 35nm | [92] |
| For liquid measurements: Poly-L-lysine solution was applied to the newly cleaved mica. Mica was dried in N2 stream with 60 µl of the investigated solution after 5 mins of incubation. The probe was soaked in the drop that covered the mica surface after 5 mins of incubation. | Diameter | 16nm |
Conclusion
Diseases alter the morphology and mechanical properties of cellular and non-cellular components of affected tissues. The ability of AFM to distinguish diseased blood tissues is promising as highlighted in this review. Rapid technological developments in single-molecule force spectroscopy may reveal the precise mechanisms of intermolecular behaviours in such diseases. AFM developments have the potential to assist pathologists in the diagnosis and grading of tissue biopsies or whole blood samples by precise qualitative observations.
The identification of biochemical and nanomechanical signals will be advantageous with the use of AFM in conjunction with other spectroscopic imaging methods. These combinations offer prognostic indicators for the disease as well as targets for treatment that allow for the analysis of the biochemical makeup and mechanical characteristics (such as stiffness or flexibility) as the disease progresses. AFM also provides promising imaging outcomes in cell surface receptors, host-pathogen interaction, cell-cell interactions, and drug-cell interactions.
In addition to imaging, force-distance curves produced using AFM have a great deal of promise for clarifying drug discovery, infectious diseases, therapeutic approaches, and the creation of novel diagnostics. It is feasible to investigate a variety of interactions, from molecules to cells, by altering the AFM tip.
The functionalization of tips opens up the range of systems that can be studied providing access to previously unattainable fast dynamic processes like ligand-induced oligomerization of receptors and transporters, the conformational dynamics of transporters, receptors, and channels during transport, signalling, and gating. This review provides a fresh view of AFM as a high-technology research tool for future applications.
The combination of AFM with imaging, force mapping, and spectroscopic techniques will prove, beneficial in understanding and management of diseases and disorders.
Abbreviations
AFM: Atomic Force Microscopy; RBC: red blood cell; Rrms: root mean squared roughness; Ra: average roughness; CML: chronic myeloid leukemia; MM: multiple myeloma; FLC: free immunoglobulin light chain; λFLC: λ free immunoglobulin light chain; T2DM: type 2 diabetes mellitus; WBCs: white blood cells; IDA: iron deficiency anemia; THAL: thalassemic erythrocytes; G6PD: glucose-6-hosphate dehydrogenase; HS: hereditary spherocytosis; EV: external membrane vesicles.
Competing Interests
The authors have declared that no competing interest exists.
References
1. Eils R, Athale C. Computational imaging in cell biology. The Journal of cell biology. 2003;161:477-81
2. Alzubaidi L, Fadhel MA, Al-Shamma O. et al. Deep learning models for classification of red blood cells in microscopy images to aid in sickle cell anemia diagnosis. Electronics. 2020;9:427
3. Tian Z, Wei Y, Yu Y. et al. Blood cell analysis: from traditional methods to super-resolution microscopy. InPhotonics. 2022;9:261
4. Garini Y, Vermolen BJ, Young IT. From micro to nano: recent advances in high-resolution microscopy. Current opinion in biotechnology. 2005;16:3-12
5. Stephens DJ, Allan VJ. Light microscopy techniques for live cell imaging. science. 2003;300:82-6
6. Janetopoulos C, Jin T, Devreotes P. Receptor-mediated activation of heterotrimeric G-proteins in living cells. Science. 2001;291:2408-11
7. Griffin BA, Adams SR, Tsien RY. Specific covalent labeling of recombinant protein molecules inside live cells. Science. 1998;281:269-72
8. Kherlopian AR, Song T, Duan Q. et al. A review of imaging techniques for systems biology. BMC systems biology. 2008;2:1-8
9. Murphy GE, Jensen GJ. Electron cryotomography. Biotechniques. 2007;43:413-21
10. Graham L, Orenstein JM. Processing tissue and cells for transmission electron microscopy in diagnostic pathology and research. Nature protocols. 2007;2:2439-50
11. Müller DJ, Dufrene YF. Atomic force microscopy as a multifunctional molecular toolbox in nanobiotechnology. InNanoscience and technology: A collection of reviews from nature journals. 2010:269-277
12. Legleiter J, Czilli DL, Gitter B. et al. Effect of different anti-Aβ antibodies on Aβ fibrillogenesis as assessed by atomic force microscopy. Journal of molecular biology. 2004;335:997-1006
13. Jagtap RN, Ambre AH. Overview literature on atomic force microscopy (AFM): Basics and its important applications for polymer characterization. 2006;13:368-84.
14. Iturri J, Toca-Herrera JL. Characterization of cell scaffolds by atomic force microscopy. Polymers. 2017;9:383
15. Muller DJ. AFM: a nanotool in membrane biology. Biochemistry. 2008Aug5;47:7986-98
16. Yang R, Xi N, Fung CK. et al. The Emergence of AFM Applications to Cell Biology: How new technologies are facilitating investigation of human cells in health and disease at the nanoscale. Journal of Nanoscience letters. 2011;1:87
17. Engel A, Müller DJ. Observing single biomolecules at work with the atomic force microscope. Nature structural biology. 2000;7:715-8
18. Barrios-Rodiles M, Brown KR, Ozdamar B. et al. High-throughput mapping of a dynamic signaling network in mammalian cells. Science. 2005;307:1621-5
19. Archakov A, Ivanov Y, Lisitsa A. et al. Biospecific irreversible fishing coupled with atomic force microscopy for detection of extremely low-abundant proteins. Proteomics. 2009;9:1326-43
20. Jain A, Liu R, Ramani B. et al. Probing cellular protein complexes using single-molecule pull-down. Nature. 2011;473:484-8
21. Archakov AI, Ivanov YD, Lisitsa AV. et al. AFM fishing nanotechnology is the way to reverse the Avogadro number in proteomics. Proteomics. 2007;7:4-9
22. Bansode SB, Gacche RN. Glycation-induced modification of tissue-specific ECM proteins: A pathophysiological mechanism in degenerative diseases. Biochimica et Biophysica Acta (BBA)-General Subjects. 2019;1863:129411
23. Theocharis AD, Theocharis DA, De Luca G. et al. Compositional and structural alterations of chondroitin and dermatan sulfates during the progression of atherosclerosis and aneurysmal dilatation of the human abdominal aorta. Biochimie. 2002;84:667-74
24. Lynch M, Barallobre-Barreiro J, Jahangiri M. et al. Vascular proteomics in metabolic and cardiovascular diseases. Journal of internal medicine. 2016;280:325-38
25. Fogel O, Richard-Miceli C, Tost J. Epigenetic changes in chronic inflammatory diseases. Advances in protein chemistry and structural biology. 2017;106:139-89
26. Sokolov I, Dokukin ME, Guz NV. Method for quantitative measurements of the elastic modulus of biological cells in AFM indentation experiments. Methods. 2013;60:202-13
27. Bremmell KE, Evans A, Prestidge CA. Deformation and nano-rheology of red blood cells: An AFM investigation. Colloids and Surfaces B: Biointerfaces. 2006;50:43-8
28. Dulińska I, Targosz M, Strojny W. et al. Stiffness of normal and pathological erythrocytes studied by means of atomic force microscopy. Journal of biochemical and biophysical methods. 2006;66:1-1
29. Zhang J, Abiraman K, Jones SM. et al. Regulation of active ICAM-4 on normal and sickle cell disease RBCs via AKAPs is revealed by AFM. Biophysical journal. 2017;112:143-52
30. Antonio PD, Lasalvia M, Perna G. et al. Scale-independent roughness value of cell membranes studied by means of AFM technique. Biochimica et Biophysica Acta (BBA)-Biomembranes. 2012;1818:3141-8
31. Kamruzzahan AS, Kienberger F, Stroh CM. et al. Imaging morphological details and pathological differences of red blood cells using tapping-mode AFM. Biological Chemistry. 2004;385:955-60
32. Girasole M, Pompeo G, Cricenti A. et al. Roughness of the plasma membrane as an independent morphological parameter to study RBCs: a quantitative atomic force microscopy investigation. Biochimica et Biophysica Acta (BBA)-Biomembranes. 2007;1768:1268-76
33. Pretorius E, du Plooy JN, Soma P. et al. Smoking and fluidity of erythrocyte membranes: A high resolution scanning electron and atomic force microscopy investigation. Nitric Oxide. 2013;35:42-6
34. Cai X, Gao S, Cai J. et al. Artesunate induced morphological and mechanical changes of Jurkat cell studied by AFM. Scanning: The Journal of Scanning Microscopies. 2009;31:83-9
35. Zhong D, Zhang Y, Zuo Q. et al. Interaction of polyethyleneimines with fibrinogen and erythrocyte membrane. Soft Materials. 2014;12:138-48
36. Deng X, Xiong F, Li X. et al. Application of atomic force microscopy in cancer research. Journal of nanobiotechnology. 2018;16:1-5
37. Minelli E, Ciasca G, Sassun TE. et al. A fully-automated neural network analysis of AFM force-distance curves for cancer tissue diagnosis. Applied Physics Letters. 2017 111
38. Gaman A, Osiac E, Rotaru I. et al. Surface morphology of leukemic cells from chronic myeloid leukemia under atomic force microscopy. Current health sciences journal. 2013;39:45
39. Mariotto AB, Feuer EJ, Howlader N. et al. Interpreting cancer incidence trends: challenges due to the COVID-19 pandemic. JNCI: Journal of the National Cancer Institute. 2023;115:1109-11
40. Rajkumar SV, Kumar S. Multiple myeloma: diagnosis and treatment. InMayo Clinic Proceedings. 2016;91:101-19
41. Hutchinson AT, Malik A, Berkahn MB. et al. Formation of assemblies on cell membranes by secreted proteins: molecular studies of free λ light chain aggregates found on the surface of myeloma cells. Biochemical Journal. 2013;454:479-89
42. Feng Y, Liu M, Li X. et al. Nanomechanical signatures of extracellular vesicles from hematologic cancer patients unraveled by atomic force microscopy for liquid biopsy. Nano Letters. 2023;23:1591-9
43. Li M, Xiao X, Zhang W. et al. AFM analysis of the multiple types of molecular interactions involved in rituximab lymphoma therapy on patient tumor cells and NK cells. Cellular Immunology. 2014;290:233-44
44. Loyola-Leyva A, Loyola-Rodríguez JP, Terán-Figueroa Y. et al. Application of atomic force microscopy to assess erythrocytes morphology in early stages of diabetes. A pilot study. Micron. 2021;141:102982
45. S AlSalhi M, Devanesan S, E AlZahrani K. et al. Impact of diabetes mellitus on human erythrocytes: atomic force microscopy and spectral investigations. International Journal of Environmental Research and Public Health. 2018;15:2368
46. Deng Y, Papageorgiou DP, Li X. et al. Quantifying fibrinogen-dependent aggregation of red blood cells in type 2 diabetes mellitus. Biophysical journal. 2020;119:900-12
47. Alexandrova A, Antonova N, Skorkina MY. et al. Evaluation of the elastic properties and topography of leukocytes' surface in patients with type 2 diabetes mellitus using atomic force microscope. Ser. Biomech. 2017;31:16-24
48. Stolbovskaya OV, Khairullin RM, Kostishko BB. et al. The study of the structural features of the lymphocytes in patients with diabetes using atomic force microscopy. InSaratov Fall Meeting 2015: Third International Symposium on Optics and Biophotonics and Seventh Finnish-Russian Photonics and Laser Symposium (PALS). 2016;9917:418-23
49. Benech JC, Benech N, Zambrana AI. et al. Diabetes increases stiffness of live cardiomyocytes measured by atomic force microscopy nanoindentation. American Journal of Physiology-Cell Physiology. 2014;307:C910-19
50. Wenderott JK, Flesher CG, Baker NA. et al. Elucidating nanoscale mechanical properties of diabetic human adipose tissue using atomic force microscopy. Scientific reports. 2020;10:20423
51. To M, Goz A, Camenzind L. et al. Diabetes-induced morphological, biomechanical, and compositional changes in ocular basement membranes. Experimental Eye Research. 2013;116:298-307
52. Oliveira RR, Medina de Mattos R, Magalhães Rebelo L. et al. Experimental diabetes alters the morphology and nano-structure of the Achilles tendon. PloS one. 2017;12:e0169513
53. Glinská G, Krajčíková K, Zakutanská K. et al. Noninvasive diagnostic methods for diabetes mellitus from tear fluid. RSC advances. 2019;9:18050-9
54. Alexandrova A, Antonova N, Kyulavska M. et al. Hemorheological and AFM-studies on the experimental clot formations in type 2 diabetes mellitus. Series on Biomechanics. 2018;32:63-73
55. Xing X, Jin H, Lu Y. et al. Detection of erythrocytes in patient with elliptocytosis complicating ITP using atomic force microscopy. Micron. 2011;42:42-6
56. Rees DC, Williams TN, Gladwin MT. Sickle-cell disease. The Lancet. 2010;376:2018-31
57. Steinberg MH, Brugnara C. Pathophysiological-based approaches to treatment of sickle cell disease. Annual Review of Medicine. 2003;54:89-112
58. Ferrone FA. Polymerization and sickle cell disease: a molecular view. Microcirculation. 2004;11:115-28
59. Maciaszek JL, Andemariam B, Lykotrafitis G. Microelasticity of red blood cells in sickle cell disease. The Journal of Strain Analysis for Engineering Design. 2011;46:368-79
60. Hillery CA, Du MC, Montgomery RR. et al. Increased adhesion of erythrocytes to components of the extracellular matrix: isolation and characterization of a red blood cell lipid that binds thrombospondin and laminin. 1996;87:4879-86.
61. Hebbel RP, Osarogiagbon R, Kaul D. The endothelial biology of sickle cell disease: inflammation and a chronic vasculopathy. Microcirculation. 2004;11:129-51
62. Zennadi R, De Castro L, Eyler C. et al. Role and regulation of sickle red cell interactions with other cells: ICAM-4 and other adhesion receptors. Transfusion clinique et biologique. 2008;15:23-8
63. Du E, Diez-Silva M, Kato GJ. et al. Kinetics of sickle cell biorheology and implications for painful vasoocclusive crisis. Proceedings of the National Academy of Sciences. 2015;112:1422-7
64. Maciaszek JL, Lykotrafitis G. Sickle cell trait human erythrocytes are significantly stiffer than normal. Journal of biomechanics. 2011;44:657-61
65. Fasano RM, Meier ER, Chonat S. Sickle cell disease, thalassemia, and hereditary hemolytic anemias. Rossi's Principles of Transfusion Medicine. 2022;326:45
66. Zhang Y, Zhang W, Wang S. et al. Detection of human erythrocytes influenced by iron deficiency anemia and thalassemia using atomic force microscopy. Micron. 2012;43:1287-92
67. Shinar E, Shalev O, Rachmilewitz EA. et al. Erythrocyte membrane skeleton abnormalities in severe beta-thalassemia. Blood. 1987;90:158-164
68. Kalow W. Genetic factors in relation to drugs. Annual Review of Pharmacology. 1965;5:9-26
69. Johnson RM, Ravindranath Y, el-Alfy MO. et al. Oxidant damage to erythrocyte membrane in glucose-6-phosphate dehydrogenase deficiency: correlation with in vivo reduced glutathione concentration and membrane protein oxidation. Blood. 1994;83:1117-1123
70. Tang J, Jiang C, Xiao X. et al. Changes in red blood cell membrane structure in G6PD deficiency: An atomic force microscopy study. Clinica Chimica Acta. 2015;444:264-70
71. King MJ, Zanella A. Hereditary red cell membrane disorders and laboratory diagnostic testing. International journal of laboratory hematology. 2013;35:237-43
72. Barcellini W, Bianchi P, Fermo E. et al. Hereditary red cell membrane defects: diagnostic and clinical aspects. Blood transfusion. 201;9:274.
73. Brown M, Wittwer C. Flow cytometry: principles and clinical applications in hematology. Clinical chemistry. 2000;46:1221-9
74. Hussain D, Ahmad K, Song J. et al. Advances in the atomic force microscopy for critical dimension metrology. Measurement Science and Technology. 2016;28:012001
75. Li Y, Lu L, Li J. Topological structures and membrane nanostructures of erythrocytes after splenectomy in hereditary spherocytosis patients via atomic force microscopy. Cell Biochemistry and Biophysics. 2016;74:365-71
76. Starodubtseva MN, Mitsura EF, Starodubtsev IE. et al. Nano-and microscale mechanical properties of erythrocytes in hereditary spherocytosis. Journal of Biomechanics. 2019;83:1-8
77. Ikuta K, Yersin A, Jimbo J. et al. Characterization of the Interaction Between Diferric Transferrin and Transferrin Receptor 2 by Functional Assays and Atomic Force Microscopy (AFM). Blood. 2008;112:1853
78. Das KC, Das M, Mohanty D. et al. Megaloblastosis: from morphos to molecules. Medical Principles and Practice. 2005;14:2-14
79. Wu Q, Liu J, Xu X. et al. Mechanism of megaloblastic anemia combined with hemolysis. Bioengineered. 2021;12:6703-12
80. Cook JD. Diagnosis and management of iron-deficiency anaemia. Best Practice & Research Clinical Haematology. 2005;18:319-32
81. Tariq S, Bilal M, Shahzad S. et al. Diagnosis of thalassemia and iron deficiency anemia using confocal and atomic force microscopy. Laser Physics Letters. 2017;14:115703
82. Bhatt S, Gething PW, Brady OJ. et al. The global distribution and burden of dengue. Nature. 2013;496:504-7
83. Schmidt AC. Response to dengue fever-the good, the bad, and the ugly. N Engl J Med. 2010;363:484-7
84. Schexneider KI, Reedy EA. Thrombocytopenia in dengue fever. Current hematology reports. 2005;4:145-8
85. Ghosh K, Gangodkar S, Jain P. et al. Imaging the interaction between dengue 2 virus and human blood platelets using atomic force and electron microscopy. Journal of electron microscopy. 2008;57:113-8
86. Sales MV, Tanabe EL, Maciel T. et al. COVID-19 Infection Changes the Functions and Morphology of Erythrocytes: A Multidisciplinary Study. Journal of the Brazilian Chemical Society. 2023;34:1185-96
87. Lyonnais S, Hénaut M, Neyret A. et al. Atomic force microscopy analysis of native infectious and inactivated SARS-CoV-2 virions. Scientific Reports. 2021;11:11885
88. Xu X, Efremov AK, Li A. et al. Probing the cytoadherence of malaria infected red blood cells under flow. PloS one. 2013;8:e64763
89. Shi H, Li A, Yin J. et al. AFM study of the cytoskeletal structures of malaria infected erythrocytes. IFMBE. 2009;23:1965-68
90. Hu M, Wang J, Cai J. et al. Nanostructure and force spectroscopy analysis of human peripheral blood CD4+ T cells using atomic force microscopy. Biochemical and biophysical research communications. 2008;374:90-4
91. Himbert S, Rheinstädter MC. Structural and mechanical properties of the red blood cell's cytoplasmic membrane seen through the lens of biophysics. Frontiers in Physiology. 2022;13:953257
92. Bairamukov V, Bukatin A, Landa S. et al. Biomechanical properties of blood plasma extracellular vesicles revealed by atomic force microscopy. Biology. 2020;10:4
Author contact
![]() Corresponding author: Prof. Rohit Srivastava (rsrivastaac.in).
Corresponding author: Prof. Rohit Srivastava (rsrivastaac.in).