- Volume 10; 2026
- Volume 9; 2025
- Volume 8; 2024
- Volume 7; 2023
- Volume 6; 2022
- Archive
- Editorial Board
- Cover Suggestion
- Index & Coverage
- Special Issues
Introduction
Methods
Results
Discussion
Abbreviations
Supplementary Material
Acknowledgements
References
International Journal of Biological Sciences
International Journal of Medical Sciences

 Global reach, higher impact
Nanotheranostics 2020; 4(4):195-200. doi:10.7150/ntno.46356 This issue Cite
Research Paper
Brain iron deposition after Ferumoxytol-enhanced MRI: A study of Porcine Brains
Ashok Joseph Theruvath1,2, Maryam Aghighi1, Michael Iv1, Hossein Nejadnik1, Jonathan Lavezo3, Laura Jean Pisani1, Heike Elisabeth Daldrup-Link1 ![]()
1. Department of Radiology, Molecular Imaging Program at Stanford, Stanford University, CA, USA.
2. Department of Diagnostic and Interventional Radiology, University Medical Center of the Johannes Gutenberg-University Mainz, 55131 Mainz, Germany.
3. Department of Pathology, School of Medicine, Stanford University, Stanford, CA, USA.
Received 2020-3-26; Accepted 2020-5-31; Published 2020-6-18
Abstract

Recent evidence of gadolinium deposition in the brain has raised safety concerns. Iron oxide nanoparticles are re-emerging as promising alternative MR contrast agents, because the iron core can be metabolized. However, long-term follow up studies of the brain after intravenous iron oxide administration have not been reported thus far. In this study, we investigated, if intravenously administered ferumoxytol nanoparticles are deposited in porcine brains.
Methods: In an animal care and use committee-approved prospective case-control study, ten Göttingen minipigs received either intravenous ferumoxytol injections at a dose of 5 mg Fe/kg (n=4) or remained untreated (n=6). Nine to twelve months later, pigs were sacrificed and the brains of all pigs underwent ex vivo MRI at 7T with T2 and T2*-weighted sequences. MRI scans were evaluated by measuring R2* values (R2*=1000/T2*) of the bilateral caudate nucleus, lentiform nucleus, thalamus, dentate nucleus, and choroid plexus. Pig brains were sectioned and stained with Prussian blue and evaluated for iron deposition using a semiquantitative scoring system. Data of ferumoxytol exposed and unexposed groups were compared with an unpaired t-test and a Mann-Whitney U test.
Results: T2 and T2* signal of the different brain regions was not visually different between ferumoxytol exposed and unexposed controls. There were no significant differences in R2* values of the different brain regions in the ferumoxytol exposed group compared to controls (p>0.05). Prussian blue stains of the same brain regions, scored according to a semiquantitative score, were not significantly different either between the ferumoxytol exposed group and unexposed controls (p>0.05).
Conclusions: Our study shows that intravenous ferumoxytol doses of 5-10 mg Fe/kg do not lead to iron deposition in the brain of pigs. We suggest iron oxide nanoparticles as a promising alternative for gadolinium-enhanced MRI.
Keywords: iron oxide nanoparticle, brain deposition, MRI
Introduction
Gadolinium-based contrast agents (GBCAs) are widely used for clinical magnetic resonance imaging (MRI). However, classical GBCAs have raised safety concerns due to a risk of gadolinium deposition in the brain [1]. Iron oxide nanoparticles are re-emerging as a promising alternative to GBCAs. Ferumoxytol, a food and drug administration (FDA)-approved iron supplement, is immediately available as an MRI contrast agent through “off-label” use. The large size of ferumoxytol nanoparticles leads to limited extravasation in normal tissues, including the brain [2]. Various authors used ferumoxytol for clinical MRI of the cardiovascular system, brain pathologies and body imaging, among others [2]. While previous investigators reported absent ferumoxytol enhancement in the normal brain of patients on MRI [2], long-term follow up studies have not been performed. Our team conducts ferumoxytol-MRI of large animals, which provided a unique opportunity to obtain imaging-histopathological correlations. The purpose of our study was to evaluate, if intravenous ferumoxytol administration leads to long-term iron deposition in brain tissue.
Methods
Studies have been approved by the animal care and use committee of our institution. We prospectively investigated the brains of 10 Göttingen minipigs: Four pigs received one (n=3) or two (n=1) intravenous injection(s) of ferumoxytol at a dose of 5 mg Fe/kg and were sacrificed 9-12 months later for ex vivo brain MRI. Six pigs were not injected with ferumoxytol and served as untreated controls. Board-certified veterinarians placed an intravenous line into the ear vein and checked the venous access through a saline flush before ferumoxytol injection. The same venous access was used to anesthetize the pig. To validate that ferumoxytol nanoparticles had been successfully injected intravenously, MRI scans of the knee joint for ferumoxytol treated pigs showed negative (hypointense) contrast enhancement within the bone marrow and no contrast enhancement in the bone marrow of control pigs (Figure S1).
The brains of all pigs underwent ex vivo MRI on a 7T MRI scanner (Bruker Biospin, Billerica, MA) using T2 weighted fast spin echo sequences (TR/TE/α =4952 ms/75 ms/90º, SL=1 mm) and T2* weighted gradient echo sequences (1366 ms/3.5-48.5 ms/70º, SL=1 mm) for creation of T2* maps. One investigator (AJT) measured R2* values (R2*=1000/T2*) of the bilateral caudate nucleus, lentiform nucleus, thalamus, dentate nucleus, and choroid plexus by carefully placing operator-defined regions of interest (ROIs) in the specific brain areas on T2* maps. R2* is proportional to tissue iron concentration [3]. We focused on brain areas where extravasation was previously described for other contrast agents [4]. Brain specimens were cut, stained with Prussian blue and evaluated for iron deposition by a neuropathology fellow (JL) and one radiology resident (AJT), using a semiquantitative scoring system (1= no iron, 2= focal iron, 3= patchy iron, 4= diffuse iron). To validate our histopathological staining method, we added a positive control of a ferumoxytol exposed liver parenchyma. Analysis of T2* maps and pathology was performed with blinding to the experimental groups. R2* data and histology score were compared between ferumoxytol exposed brains and controls, using an unpaired t-test and a Mann-Whitney U test, respectively (p<0.05).
Results
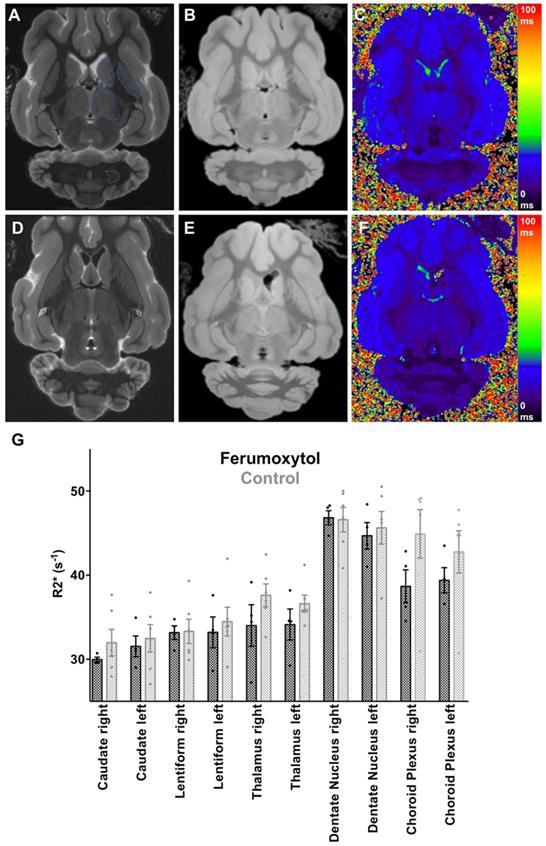
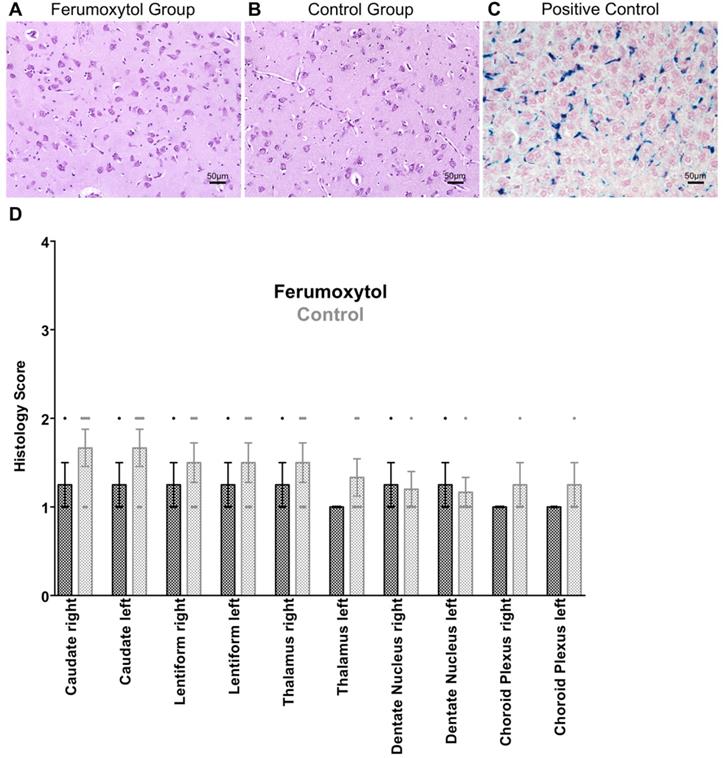
We did not note any visual difference in T2 or T2* signal of any brain area between ferumoxytol exposed animals and controls (Figure 1A-F). Accordingly, there were no significant differences in R2* values of different brain regions in the ferumoxytol exposed group compared to controls, respectively (Figure 1G): right caudate nucleus (29.97±0.27 vs. 31.98±1.56; p=0.34) left caudate nucleus (31.54±1.24 vs. 32.49±1.64; p=0.69), right lentiform nucleus (33.18±0.81 vs. 33.32±1.45; p=0.94), left lentiform nucleus (33.21±1.83 vs. 34.49±1.71; p=0.63), right thalamus (34.03±2.48 vs. 37.62±1.36; p=0.20), left thalamus (34.14±1.84 vs. 36.63±1.01; p=0.23), right dentate nucleus (46.82±0.84 vs. 46.59±1.46; p=0.91), left dentate nucleus (44.68±1.57 vs. 45.64±1.94; p=0.73), right choroid plexus (38.68±1.96 vs. 44.91±2.88; p=0.15) and left choroid plexus (39.40±1.50 vs. 42.78±2.50; p=0.34). In addition, we did not find any difference in Prussian blue staining between the two groups (Figure 2A-C). The histology score in different brain regions was not significantly different in the ferumoxytol exposed group compared to controls (p>0.05; Figure 2D).
Ex vivo Brain MRI with R2* Quantification of Specific Brain Areas. (A) T2-weighted (TR/TE/α=4952/75/90) and (B) T2*-weighted (TR/TE/α=1366/3.5/70) image with (C) corresponding color encoded T2* map of a ferumoxytol exposed pig brain with regions of interest (blue line) in the caudate nucleus, lentiform nucleus, thalamus and dentate nucleus. (D) T2-weighted and (E) T2*-weighted image with (F) corresponding color encoded T2* map of a control pig brain. No visual difference between the two groups is demonstrated. (G) Scatterplot with bar shows corresponding R2* values with no significant differences for any of the quantified brain regions between ferumoxytol exposed and control pig brains (p>0.05). Data are means and standard errors of the mean of four ferumoxytol-exposed pigs and six controls.
Prussian blue staining of specific brain areas. (A) Prussian blue staining of ferumoxytol exposed caudate nucleus and (B) unexposed caudate nucleus shows no sign of iron oxide nanoparticle retention. (C) Positive control with Prussian blue staining of ferumoxytol exposed liver parenchyma. (D) Scatterplots with bars show no significant differences in histological scoring for iron deposition in different brain areas (p>0.05; 1= no iron, 2= focal iron, 3= patchy iron, 4= diffuse iron). Data are means and standard errors of the mean of four ferumoxytol-exposed pigs and six controls.
Discussion
Our imaging-histopathological correlation suggests that ferumoxytol is not retained in brain tissue after intravenous administration at doses of 5-10 mg Fe/kg. Long-term follow up studies showed no significant differences in brain iron content between ferumoxytol exposed porcine brains and unexposed controls. This is in accordance with previous reports that described absence of iron enhancement of the normal brain within hours or days after ferumoxytol administration [2, 5].
Studies with GBCA demonstrated a correlation between cumulative GBCA dose and GBCA retention in the brain [1]. Preclinical studies have highlighted the importance of the choroid plexus in the regulation of iron metabolism in the brain [6]. Clinical studies have shown hypointense enhancement of the choroid plexus on MRI after multiple blood or iron transfusions [5, 7]. Therefore, it is likely, that iron brain deposition is dose dependent.
Several studies determined the minimum quantity of iron oxide nanoparticles that can be detected. In a study using Molday iron oxide nanoparticles (diameter: 30 nm, similar size to ferumoxytol) the minimum detectable concentration in horse serum on a 7T MRI scanner was 38 pmol/l [8]. Several clinical trials determined threshold iron concentrations that can be detected in tissues: In postmortem brain tissues from Alzheimer's disease patients, a threshold iron concentration of 50 µg Fe/g wet tissue was determined, above which iron could be detected in the brain on MR images at 4.7 Tesla [9]. In another study of human postmortem brains specimen, iron concentration as low as 30 ± 12 µg Fe/g and up to 205 ± 32 µg Fe/g wet tissue correlated significantly with R2* values on a 3T MRI scanner [10]. Studies comparing Prussian blue stains with MRI have reported an overlap of positive Prussian blue stains and T2* hypointensities on MRI scans obtained on a 7T MRI scanner for patients with Parkinson's disease [11]. In another study, hypointensities in the subthalamic nucleus on a 9.4T MRI corresponded with regions of high Prussian blue staining [12].
Our study used a 7T MRI scanner and iron-sensitive T2* sequences which can detect very low iron concentrations, as described in the literature. Therefore, differences in brain iron deposition between the groups in our study should have been detected with Prussian blue staining and MRI.
Previous clinical trials for MR imaging applications used doses of ferumoxytol from 1 to 8 mg Fe/kg [13-16]. Our team uses a dose of 5 mg Fe/kg for clinical applications. This dose is comparable with previous studies and is lower than FDA-approved doses for treatment of anemia (2× 510mg per patient) [2, 17-20]. In general, ferumoxytol nanoparticles are well tolerated and rare anaphylactic reactions have been reported in the adult patient population [21-24]. This is in accordance with our experience in pediatric patients who received ferumoxytol for MRI and showed few and minor side effects [25]. As recommended by the FDA, we diluted ferumoxytol 1:3 with saline and slowly infused it over 15 minutes to avoid complement activation-related pseudoallergies (CARPA) and hypotensive reactions, which are observed with rapid injections, and which can mimic true anaphylaxis [5].
Several investigators including our own group started to use ferumoxytol nanoparticles for MR imaging of vascular malformations [26, 27], cardiovascular abnormalities [28] and tumors in children [19]. The sensitivity and specificity of ferumoxytol for imaging brain pathologies in patients has been extensively studied [29-32]. Since ferumoxytol is FDA-approved for the treatment of anemia, results from this project can be directly translated to clinical applications via an off-label use. Therefore, ferumoxytol-enhanced MRI could address an important need for clinicians as a new alternative to Gd-enhanced MRI scans, which can pose a risk of long-term Gd-deposition in the brain of patients. The advantage of iron oxides compared to GBCA is that iron products can be metabolized. Of course, the capacity of the human body to metabolize iron products can be saturated with repetitive injections and the iron clearance can be impaired in case of metabolic diseases. Future studies will have to show, which iron doses and/or physiological conditions might lead to significant brain iron deposition or limited iron clearance.
Abbreviations
GBCA: Gadolinium-based contrast agent; MRI: magnetic resonance imaging; FDA: food and drug administration; TR: time of repetition; TE: time of echo; SL: slice thickness.
Supplementary Material
Supplementary figure S1.
Acknowledgements
The authors acknowledge support from the National Institute of Arthritis and Musculoskeletal and Skin Diseases (NIAMS) grant numbers 5R01AR054458. We thank Sid Nair for his valuable help and assistance with processing the brain specimens. We would also like to acknowledge Nathan Norton Ng who helped with the statistical analysis. Both did not receive compensation for their work.
Competing Interests
The authors have declared that no competing interest exists.
References
1. Kanda T, Ishii K, Kawaguchi H, Kitajima K, Takenaka D. High signal intensity in the dentate nucleus and globus pallidus on unenhanced T1-weighted MR images: relationship with increasing cumulative dose of a gadolinium-based contrast material. Radiology. 2014;270:834-41
2. Toth GB, Varallyay CG, Horvath A, Bashir MR, Choyke PL, Daldrup-Link HE. et al. Current and potential imaging applications of ferumoxytol for magnetic resonance imaging. Kidney Int. 2017;92:47-66
3. Hankins JS, McCarville MB, Loeffler RB, Smeltzer MP, Onciu M, Hoffer FA. et al. R2* magnetic resonance imaging of the liver in patients with iron overload. Blood. 2009;113:4853-5
4. Guo BJ, Yang ZL, Zhang LJ. Gadolinium Deposition in Brain: Current Scientific Evidence and Future Perspectives. Front Mol Neurosci. 2018;11:335
5. Daldrup-Link H. 10 Things you might not know about Iron Oxide Nanoparticles. Radiology. 2017;284:616-29
6. Rouault TA, Zhang DL, Jeong SY. Brain iron homeostasis, the choroid plexus, and localization of iron transport proteins. Metab Brain Dis. 2009;24:673-84
7. Kira R, Ohga S, Takada H, Gondo K, Mihara F, Hara T. MR choroid plexus sign of iron overload. Neurology. 2000;55:1340
8. Alvares RDA, Szulc DA, Cheng HL. A scale to measure MRI contrast agent sensitivity. Sci Rep. 2017;7:15493
9. House MJ, St Pierre TG, Kowdley KV, Montine T, Connor J, Beard J. et al. Correlation of proton transverse relaxation rates (R2) with iron concentrations in postmortem brain tissue from alzheimer's disease patients. Magn Reson Med. 2007;57:172-80
10. Langkammer C, Krebs N, Goessler W, Scheurer E, Ebner F, Yen K. et al. Quantitative MR imaging of brain iron: a postmortem validation study. Radiology. 2010;257:455-62
11. Blazejewska AI, Schwarz ST, Pitiot A, Stephenson MC, Lowe J, Bajaj N. et al. Visualization of nigrosome 1 and its loss in PD: pathoanatomical correlation and in vivo 7 T MRI. Neurology. 2013;81:534-40
12. Massey LA, Miranda MA, Zrinzo L, Al-Helli O, Parkes HG, Thornton JS. et al. High resolution MR anatomy of the subthalamic nucleus: imaging at 9.4 T with histological validation. Neuroimage. 2012;59:2035-44
13. Gahramanov S, Muldoon LL, Varallyay CG, Li X, Kraemer DF, Fu R. et al. Pseudoprogression of glioblastoma after chemo- and radiation therapy: diagnosis by using dynamic susceptibility-weighted contrast-enhanced perfusion MR imaging with ferumoxytol versus gadoteridol and correlation with survival. Radiology. 2013;266:842-52
14. Varallyay CG, Nesbit E, Horvath A, Varallyay P, Fu R, Gahramanov S. et al. Cerebral blood volume mapping with ferumoxytol in dynamic susceptibility contrast perfusion MRI: Comparison to standard of care. J Magn Reson Imaging. 2018;48:441-8
15. Varallyay CG, Nesbit E, Fu R, Gahramanov S, Moloney B, Earl E. et al. High-resolution steady-state cerebral blood volume maps in patients with central nervous system neoplasms using ferumoxytol, a superparamagnetic iron oxide nanoparticle. J Cereb Blood Flow Metab. 2013;33:780-6
16. Christen T, Ni W, Qiu D, Schmiedeskamp H, Bammer R, Moseley M. et al. High-resolution cerebral blood volume imaging in humans using the blood pool contrast agent ferumoxytol. Magn Reson Med. 2013;70:705-10
17. Theruvath AJ, Nejadnik H, Muehe AM, Gassert F, Lacayo NJ, Goodman SB. et al. Tracking Cell Transplants in Femoral Osteonecrosis with Magnetic Resonance Imaging: A Proof-of-Concept Study in Patients. Clin Cancer Res. 2018;24:6223-9
18. Aghighi M, Theruvath AJ, Pareek A, Pisani LL, Alford R, Muehe AM. et al. Magnetic Resonance Imaging of Tumor-Associated Macrophages: Clinical Translation. Clin Cancer Res. 2018;24:4110-8
19. Muehe AM, Theruvath AJ, Lai L, Aghighi M, Quon A, Holdsworth SJ. et al. How to Provide Gadolinium-Free PET/MR Cancer Staging of Children and Young Adults in Less than 1 h: the Stanford Approach. Mol Imaging Biol. 2018;20:324-35
20. Muehe AM, Siedek F, Theruvath AJ, Seekins J, Spunt SL, Pribnow A. et al. Differentiation of benign and malignant lymph nodes in pediatric patients on ferumoxytol-enhanced PET/MRI. Theranostics. 2020;10:3612-21
21. Hassan N, Cahill J, Rajasekaran S, Kovey K. Ferumoxytol infusion in pediatric patients with gastrointestinal disorders: first case series. Ann Pharmacother. 2011;45:e63
22. Lu M, Cohen MH, Rieves D, Pazdur R. FDA report: Ferumoxytol for intravenous iron therapy in adult patients with chronic kidney disease. Am J Hematol. 2010;85:315-9
23. Singh A, Patel T, Hertel J, Bernardo M, Kausz A, Brenner L. Safety of ferumoxytol in patients with anemia and CKD. Am J Kidney Dis. 2008;52:907-15
24. Nguyen KL, Yoshida T, Kathuria-Prakash N, Zaki IH, Varallyay CG, Semple SI. et al. Multicenter Safety and Practice for Off-Label Diagnostic Use of Ferumoxytol in MRI. Radiology. 2019;293:554-64
25. Muehe AM, Feng D, von Eyben R, Luna-Fineman S, Link MP, Muthig T. et al. Safety Report of Ferumoxytol for Magnetic Resonance Imaging in Children and Young Adults. Invest Radiol. 2016;51:221-7
26. Iv M, Choudhri O, Dodd RL, Vasanawala SS, Alley MT, Moseley M. et al. High-resolution 3D volumetric contrast-enhanced MR angiography with a blood pool agent (ferumoxytol) for diagnostic evaluation of pediatric brain arteriovenous malformations. J Neurosurg Pediatr. 2018;22:251-60
27. Dosa E, Tuladhar S, Muldoon LL, Hamilton BE, Rooney WD, Neuwelt EA. MRI using ferumoxytol improves the visualization of central nervous system vascular malformations. Stroke. 2011;42:1581-8
28. Lai LM, Cheng JY, Alley MT, Zhang T, Lustig M, Vasanawala SS. Feasibility of ferumoxytol-enhanced neonatal and young infant cardiac MRI without general anesthesia. J Magn Reson Imaging. 2017;45:1407-18
29. Farrell BT, Hamilton BE, Dosa E, Rimely E, Nasseri M, Gahramanov S. et al. Using iron oxide nanoparticles to diagnose CNS inflammatory diseases and PCNSL. Neurology. 2013;81:256-63
30. Hamilton BE, Woltjer RL, Prola-Netto J, Nesbit GM, Gahramanov S, Pham T. et al. Ferumoxytol-enhanced MRI differentiation of meningioma from dural metastases: a pilot study with immunohistochemical observations. J Neurooncol. 2016;129:301-9
31. Iv M, Samghabadi P, Holdsworth S, Gentles A, Rezaii P, Harsh G. et al. Quantification of Macrophages in High-Grade Gliomas by Using Ferumoxytol-enhanced MRI: A Pilot Study. Radiology. 2019;290:198-206
32. McConnell HL, Schwartz DL, Richardson BE, Woltjer RL, Muldoon LL, Neuwelt EA. Ferumoxytol nanoparticle uptake in brain during acute neuroinflammation is cell-specific. Nanomedicine. 2016;12:1535-42
Author contact
![]() Corresponding author: Heike E. Daldrup-Link, Molecular Imaging Program at Stanford, Stanford University, 725 Welch Road, Stanford, CA 94304, E-mail: heikededu.
Corresponding author: Heike E. Daldrup-Link, Molecular Imaging Program at Stanford, Stanford University, 725 Welch Road, Stanford, CA 94304, E-mail: heikededu.