- Volume 10; 2026
- Volume 9; 2025
- Volume 8; 2024
- Volume 7; 2023
- Volume 6; 2022
- Archive
- Editorial Board
- Cover Suggestion
- Index & Coverage
- Special Issues
Introduction
Materials and Methods
Results and Discussion
Conclusions
Supplementary Material
Acknowledgements
References
International Journal of Biological Sciences
International Journal of Medical Sciences

 Global reach, higher impact
Nanotheranostics 2019; 3(1):113-119. doi:10.7150/ntno.30924 This issue Cite
Research Paper
Alkyne- and Nitrile-Anchored Gold Nanoparticles for Multiplex SERS Imaging of Biomarkers in Cancer Cells and Tissues
Mingmin Li2#, Jianzhen Wu1#, Mengtian Ma1, Zhichao Feng1, Ze Mi1, Pengfei Rong1 ![]() , Dingbin Liu2
, Dingbin Liu2 ![]()
1. Department of Radiology, The Third Xiangya Hospital, Central South University, Changsha, Hunan 410013, China.
2. College of Chemistry, Research Center for Analytical Sciences, State Key Laboratory of Medicinal Chemical Biology, and Tianjin Key Laboratory of Molecular Recognition and Biosensing, Nankai University, Tianjin 300071, China.
# M. L. and J. W. contributed equally to this work.
Received 2018-10-24; Accepted 2019-2-5; Published 2019-2-8
Abstract

Surface-enhanced Raman spectroscopy (SERS) has proven a powerful tool for multiplex detection and imaging due to its narrow peak width and high sensitivity. However, conventional SERS reporters are limited to thiolated compounds, which have limitations such as chemical stability and spectral overlap. Here, we used alkyne- and nitrile-bearing molecules to directly fabricate a set of SERS tags for multiplex imaging. The alkyne and nitrile groups act as both the anchoring points to interact with gold nanoparticle (AuNP) surfaces and the reporters exhibiting strong and nonoverlapping signals in the cellular Raman-silent region. The SERS tags were subsequently modified with different antibodies for multicolor imaging of cancer cells and human breast cancer tissues. The reporters have a simple and readily accessible structure, hence providing new opportunities to prepare SERS nanoprobes
Keywords: surface-enhanced Raman spectroscopy (SERS), gold nanoparticles, multicolor imaging, background-free detection
Introduction
The simultaneous profiling of biomarkers in biological samples is very important for disease diagnostics and monitoring the efficacy of drug treatments [1,2]. Currently, the standard clinical method for identification of diagnostic biomarkers and target molecules is immunohistochemistry (IHC) [3]. However, IHC only shows one color and is unable to detect multiple target molecules in a single experiment. As alternatives, many other technologies, such as mass spectrometry (MS) [4], protein chips [5], reverse transcription-PCR [6], and fluorescence assays [7, 8], have been developed for the detection of multiple biomarkers. However, these methods face long-standing limitations. For example, the majority of the approaches require a destructive method to prepare cells or tissue specimens that may lead to the loss of three-dimensional cellular and tissue morphological information. In the commonly used fluorescence imaging, the emission peaks are usually wide, leading to spectral crosstalk in multiplex imaging. Additionally, fluorescent probes often suffer from photobleaching. Therefore, a new technique for multiplex imaging of biomarkers of interest in clinical samples is highly desirable.
Surface-enhanced Raman spectroscopy (SERS) is an ultrasensitive vibrational spectroscopic technique that has rapidly developed in recent years. The development of SERS tags represents a major step forward in the analysis of biological samples due to their distinct properties. First, Raman signals are resistant to photobleaching, thus possessing good stability under various conditions. Second, the sensitivity of SERS can be as high as the single-molecule level [9-11]. Moreover, the Raman signals exhibit a peak width of approximately 1-2 nm [12-14], which is much narrower than the peak width of traditional fluorophores and quantum dots. Thus, SERS tags are quite suitable for multiplex detection. SERS serves as a new methodology for cancer biomarker profiling with enhanced diagnostic accuracy, particularly when used to assist with intraoperative surgical guidance [15-18].
Currently, the commercially available Raman reporters incorporated in SERS tags are restricted to a few Raman-active compounds that are facing several problems. On one hand, Raman reporters are generally thiolated compounds, which are anchored onto SERS substrates through high-affinity metal-sulfur bonds. However, thiols are prone to oxidation, rendering them unstable [19]. On the other hand, traditional Raman reporters possess multiple peaks in the fingerprint region (1000-1700 cm-1) [20-23], which typically overlap with each other and cause crosstalk. Furthermore, the SERS signals might overlap or even merge with the complex background signals derived from endogenous biological substances such as proteins, phospholipids, cytochrome, etc., especially when they adsorb to the SERS substrates. Therefore, new Raman reporters with high spectral resolution and a lack of background interference must be synthesized. We and other groups have shown that several exogenous moieties, including alkynes, nitriles, azides, and deuterium, show single narrow vibrational peaks in the Raman-silent region (1800-2800 cm-1) [24-29], where the signals of biospecies are negligible, making these chemical groups highly suitable for multiplex detection.
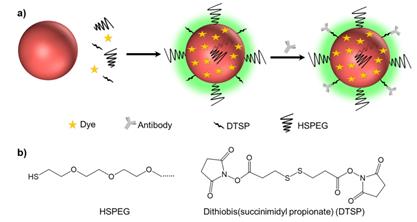
In this report, the exogenous alkyne and nitrile groups serve as both anchors and background-free reporters. Alkyne and nitrile groups directly bind to the surfaces of metal NPs via σ-π [30] or π-π interactions [31] to produce strong single Raman peaks in the silent region. We developed a library of Raman reporters containing these two functional groups and introduced a one-pot approach to prepare SERS tags for multiplex targeting and multicolor identification of cancer biomarkers with nonoverlapping Raman signals (Scheme 1). These SERS tags were further conjugated with different antibodies against estrogen receptor (ER), progesterone receptor (PR), and epidermal growth factor receptor (EGFR) for multicolor imaging of three different biological targets in cancer cells and human breast cancer tissues.
(a) Schematic illustrating of the method used to prepare background-free SERS tags. (b) The molecular structures of HSPEG and dithiobis (succinimidyl propionate) (DTSP).
Materials and Methods
Materials
All reagents used in the experiments were of analytical grade. HS-PEG-OCH3 (MW 2000) was obtained from Sigma Aldrich, and 3,3'-dithio (succinimidylpropionate) (DTSP) was purchased from Heowns (Tianjin, China). Gold (III) chloride trihydrate (HAuCl4•3H2O) and hydroxylammonium chloride were purchased from Aladdin (Shanghai, China). Trisodium citrate was purchased from Alfa Aesar (Tianjin, China). All antibodies were obtained from Abcam (Shanghai, China). Raman dyes were purchased from Sanbang Reagent Co., Ltd. (Changchun, China). Deionized water (Milli-Q grade, Millipore) with a resistivity of 18.2 MΩ•cm was used throughout the experiment. A JEOL 1400 TEM model operating at an accelerating voltage of 100 kV was employed to capture TEM images in this study. A Hitachi U-3900 UV-vis spectrophotometer was used to record the absorbance spectrum of AuNP solutions. Dynamic light scattering (DLS) was performed on a Zeta Sizer Nano ZS (Malvern Zetasizer 300HS and He/Ne laser at 632.8 nm at scattering angles of 90 at 25 °C). A Renishaw in Via Raman microscope was used to record the Raman spectrum through the experiments. The Raman spectra of a solution was measured in capillary tubes with average length of 10 cm and diameter of 0.5 mm. Briefly, a 633 nm laser was used for sample excitation in all experiments.
The preparation of citrate-capped AuNPs (60 nm)
We adopted AuNPs with a diameter of 60 nm as SERS substrates. AuNPs with a narrow size distribution were prepared through the reduction of chloroauric acid with hydroxylamine hydrochloride, which consists of two steps. First, we synthesized 13 nm AuNPs. Then, 60 nm AuNPs were synthesized via a seed growth method. Briefly, hydroxylamine hydrochloride (0.2 M, 1 mL) was quickly added to the 13 nm AuNP (0.098 nM, 100 mL) solution, and then an aqueous solution of HAuCl4 (100 mM, 832 μL) in 40 mL of water was added dropwise with vigorous stirring, followed by the addition of another 1 mL of hydroxylamine hydrochloride (0.2 M). The resulting mixture was stirred for another 30 min. Finally, 1.6 mL of a 10% w/w trisodium citrate solution was added to the solution described above, and the mixture was stirred for another 15 min. The resulting colloidal solution was characterized using UV-Vis spectroscopy, and its maximal absorption band was observed at ∼536 nm.
The preparation of SERS tags
We prepared the SERS tags using a “one-pot” method. First, 0.5 μL of an SDS solution (10%) was added to 4 mL of a colloidal gold solution to prevent it from nonspecific aggregation. Next, 0.2 μL of 100 μM Raman reporters and 10 μL of 20 μM DTSP were added to the gold solutions and the mixture was shaken for 20 min. Then, 10 μL of 20 μM PEG-HS was added and shaken for another 2 h to coat the surface of AuNPs and further protect the SERS tags [32]. The excess PEG, Raman reporters and DTSP were removed by centrifugation at 5000 rpm for 10 min. The precipitate was dispersed in 1 mL of DI water and then incubated with 2.2 μL of antibodies (1 mg/mL) for 1 h. We removed the unconjugated free antibodies by centrifugation at 3000 rpm for 10 min. The precipitates were finally dispersed into 1 mL of Tris-HCl buffer (pH=8.5, 10×) to inactivate the unbound succinimide ester, thus avoiding nonspecific adsorption to tissue samples in subsequent experiments. After a 3 h incubation, we centrifuged the solution at 3000 rpm for 10 min again and dispersed the precipitates into PBS (pH=7.4, 1×) for imaging experiments.
Cell experiments
The human breast cancer cell line MCF-7 and 3T3 cells were used in our experiments. Cells were cultured in RPMI 1640 medium (GIBCO) supplemented with 10% fetal bovine serum (FBS, GIBCO) and penicillin/streptomycin (1%, 100 μg/mL). The MTT assay was applied to assess cytotoxicity as reported elsewhere with minor modifications [24]. MCF-7 cells were seeded in a 96-well plate at a density of 5×10⁴ cells/mL and cultured for 24 h. The adherent cells were then treated with varied concentrations of the as-prepared probes (0, 0.0125, 0.025, 0.05, 0.1, and 0.2 nM) for 24 h. The solution was replaced with 190 µL of fresh medium and 10 µL of MTT (5 mg/mL) and incubated at 37 °C for 4 h. The dark blue formazan crystals were dissolved in 150 µL of dimethylsulfoxide and the absorbance at 490 nm was measured using a microplate reader.
For cell imaging experiments, MCF-7 and 3T3 cells were seeded in 48-well plate on a glass coverslip at a density of 5×10⁴ cells/mL. The plate was incubated in a 37 °C incubator with a 5% CO2 atmosphere for 24 h, ensuring cell attachment to the walls. The adherent cells were washed with PBS (1×, pH=7.4) to remove cellular metabolites. Afterwards, fresh culture medium containing the mixture of as-prepared probes with a final concentration of 0.1 nM (0.033 nM for each SERS tag) was added and incubated for 10 h. Then, all wells were washed with PBS 6 times to remove nonspecific signals, treated with 150 μL of a paraformaldehyde solution for 30 min to fix the cells, and rinsed with PBS 2 times. Before imaging, we placed the round coverslips on a glass slide and mounted the sample using glycerol-PBS. Images of the cells were obtained using a 633 nm (He-Ne laser) laser at a power of 30 mW and a 50× objective lens. The laser was focused to a micrometer-sized spot, and images were captured using scan pattern composed of 1.0 μm steps with an integration time of 1.0 s/pixel in the X and Y directions.
Tissue imaging experiments
Both the healthy human tissue slices and tissue slices from patients were collected from the Third Xiangya Hospital, Changsha, China. These samples were diagnosed using the current gold-standard methods in the clinic, such as a histopathological examination, before being detected with our SERS tags. The clinical samples were stored at -80 °C until further use. The handling of these samples followed all necessary safety precautions.
1) Before imaging, we first dewaxed and hydrated the tissue slices by placing the slices at 65 °C for 1 h and then following the steps described below.
Reagent and time
| Reagent | Time |
|---|---|
| dimethylbenzene | 45 min, 2 times |
| ethanol (100%) | 10 min, 1 time |
| ethanol (90%) | 10 min, 1 time |
| ethanol (80%) | 10 min, 1 time |
| ethanol (70%) | 10 min, 1 time |
| tap water | 5 min, 2 times |
| deionized water | 5 min, 2 times |
2) Antigen retrieval (microwave retrieval method): The slides were immersed in a container containing 0.01 M citrate buffer, placed in a microwave oven, and heated to boiling for 15 min.
3) Blocking of nonspecific antigens: After the slides were rinsed with PBS (pH=7.4, 1×) twice for 4 min each, they were incubated with 100 μL of BSA (4% in PBS) at 37 °C for 30 min to block the binding of nonspecific antigens.
4) Then, we removed the BSA and gently dried the remaining serum around the slices for further use. We later subsequently incubated the slices with 100 μL of the probes for 1 h and thoroughly rinsed the slices with PBS to remove the probes that adsorbed nonspecifically. Finally, 10 μL of glycerol were added to seal the slide for SERS imaging.
Results and Discussion
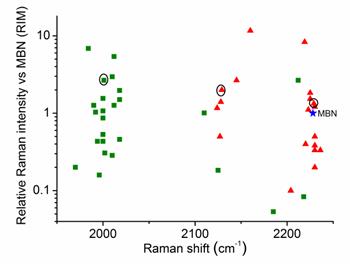
Throughout the study, AuNPs with a diameter of 60 nm were used as SERS substrates. Both the number of Raman-active chemical groups and the substituent groups in Raman reporters affect the position and intensity of the Raman peak.[30, 31] This approach represents a novel method for constructing a library of Raman reporters by screening a variety of molecules bearing alkyne or nitrile group. In addition, measurement of the relative intensities normalized to a standard molecule is a common method for comparing the signal intensities between different reporters. In this study, we selected 4-mercaptobenzonitrile (MBN) as the standard Raman dye. We screened 44 commercial compounds as Raman reporters that contained either an alkyne or nitrile group. These reporters were incorporated into SERS tags using a “one-pot” method (Scheme 1). We subsequently evaluated their Raman shifts and intensities, counted the test results, and constructed a potential reporter library for further use (Figure 1 and Figure S1, ESI†).
Comparison of the signal intensities of the single bands derived from alkyne (green) and nitrile (red) reporters in the silent region for 44 different SERS tags after excitation at 633 nm. The reporter concentration used to prepare each tag was 5 mM. 4-Mercaptobenzonitrile (MBN) was chosen as the reference. The three reporters shown in the circles were eventually used to prepare three SERS tags for multiplex profiling of cancer biomarkers in this study.
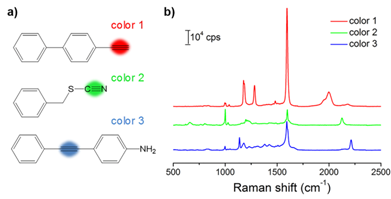
With the goal of multiplex detection, ideal SERS tags should show single narrow peaks that are highly resolved from each other. With the reporter library in hand, we functionalized the substrates with three different Raman reporters, 4-ethynyl-bipheny (color 1), phenylthiocyanate (color 2), and 4-(phenylethynyl)aniline (color 3), all of which show relatively high signal intensities (Figure 2). The concentration of the reporters was set to 5 mM. Single SERS peaks appeared in the silent region and were completely resolved from each other.
(a) Molecular structures of three background-free Raman reporters. (b) SERS spectra of the three reporter-incorporated SERS tags. The excitation wavelength was 633 nm, and the exposure time was 2 s.
Colloidal stability is an important parameter to evaluate the performance of a nanoprobe. We tested the stability of the synthesized SERS tags using UV-Vis spectroscopy and SERS. The as-prepared SERS tags were well dispersed in an aqueous solution without agglomeration, as indicated by the red color of the AuNP solution and the corresponding typical absorption band observed at approximately 540 nm (Figure S2, ESI†). Moreover, the Raman signals displayed negligible changes within five days (Figure S3, ESI†). In addition, the pH stability of SERS tags is also an important factor to estimate the performance of a nanoprobe. We then tested signal stability of the SERS tags in solutions with different pH values (from 4 to 8). Tag 1 was used as a representative probe in this experiment. The same concentration (0.13 nM) of the as-prepared tag 1 was redispersed in the solutions for 12 h and then SERS spectra were recorded. The Raman signals displayed negligible changes in the abovementioned solutions (Figure S4, ESI†). Based on these results, a strong coordination effect occurring between the two unsaturated alkyne and nitrile groups and AuNPs is essential for maintaining both the colloidal and signal stability of the SERS tags in aqueous media.
Unlike conventional Raman reporters, our SERS tags incorporating alkyne and nitrile groups produced single and narrow bands in the cellular Raman-silent region. Moreover, their signals were completely separated from each other, making these tags suitable for multicolor SERS imaging. We subsequently functionalized the SERS tags with targeting ligands by incubating AuNPs with the mixture of Raman reporters and the linker DTSP. The N-hydroxysuccinimide ester in DTSP reacts with the amino groups in protein ligands [33, 34], thus endowing SERS tags with targeting ability. Using this conjugation strategy, the three different tags were conjugated to three primary antibodies against ER, PR, and EGFR, respectively, which are routinely detected in surgical pathology laboratories. The UV-Vis spectrum shows that the maximum absorption peak has a certain redshift (Figure S5a, ESI†), indicating that the particle size increased after the antibody conjugation. Dynamic light scattering (DLS) results further confirmed this observation (Figure S5b-d, ESI†).
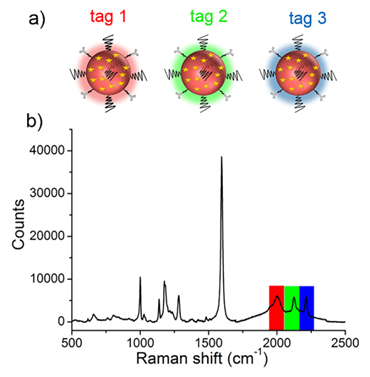
Before performing molecular imaging, we mixed the three different SERS tags in equal proportions (0.13 nM for each tag), and the SERS signals of the mixed solution were recorded with a confocal Raman microscope. As shown in Figure 3, the red channel at 2000 cm-1, green channel at 2120 cm-1, and blue channel at 2230 cm-1 were assigned to tag 1, tag 2, and tag 3, respectively. Clearly, the three peaks located in the cellular Raman-silent region showed negligible spectral overlap. Thus, the as-prepared SERS tags were suitable for background-free multiplex imaging.
(a) Schematic illustrating the three SERS tags. (a) Tag 1, tag 2, and tag 3 were conjugated with antibodies against ER, EGFR, and PR, respectively. (b) The SERS spectrum of the mixture of tags in equal proportions (0.13 nM for each type of tag).
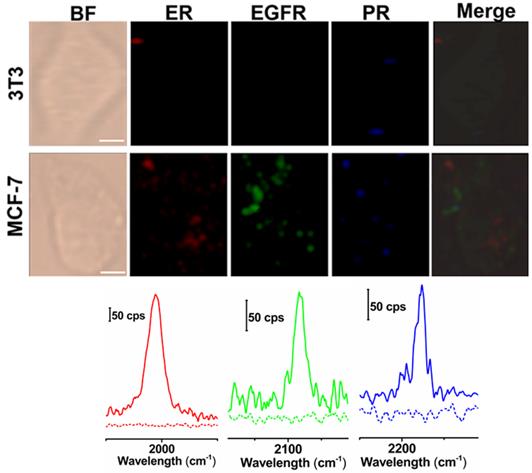
Next, we applied these three background-free SERS nanoprobes to image biomarkers expressed in cancer cells. The MCF-7 cell line was used as the experimental group, as it expresses ER, EGFR, and PR at high levels [35], while the normal cell line 3T3 was used as a control because the expression of the biomarkers is downregulated. The excellent biocompatibility of the tags was observed in MCF-7 cells (Figure S6, ESI†). The cell lines were treated with the mixture of tag 1, tag 2, and tag 3 for 10 h, then washed thoroughly with PBS buffer, and finally fixed with a paraformaldehyde solution for 30 min before imaging. The Raman signals in the red, green, and blue channels represent the expression of ER, EGFR, and PR, respectively (Figure 4). The Raman signals in the MCF-7 cell are much stronger than that in the 3T3 cell, due to the enhanced uptake of the SERS tags in MCF-7 cells mediated by the overexpressed receptors, consistent with the results reported elsewhere [35-37]. As shown in the spectra, the peaks in the cellular Raman-silent region were clearly distinguished without crosstalk. We then counted the Raman signals of the three channels for the MCF-7 and 3T3 cell lines to quantitatively analyze biomarker expression. As shown in Figure S7, the signal intensity of these three biomarkers in each MCF-7 cell was stronger than the signals detected in 3T3 cells. On the other hand, we explored whether the signals were derived from the tags that nonspecifically adsorbed on cell surfaces. MCF-7 cells were incubated with the same concentration of tag 1 or the mixture of these three tags without the conjugation of the targeting antibodies, then washed thoroughly with PBS buffer, and finally fixed with a paraformaldehyde solution for 30 min before Raman imaging. Raman signals were recorded using the same procedures as described above. Very weak signals were detected on the cells treated with either tag 1 or the mixture of all the three tags without conjugated antibodies (Figure S8, ESI†). Based on these results, the tags rarely bound to the cell surfaces in the absence of the corresponding antibodies. The imaging results confirm that these background-free SERS tags achieve multiplex profiling of biomarkers in single cells without generating false positive signals.
Multiplex background-free imaging of ER, EGFR and PR signals in 3T3 and MCF-7 cell lines that were simultaneously labeled with the same concentrations (0.033 nM) of tag 1, tag 2, and tag 3. Scale bar: 5 µm. The Raman spectra in the red, green, and blue channels correspond to 3T3 (dotted lines) and MCF-7 cells (solid lines) labeled with tag 1, tag 2, and tag 3, respectively. The SERS images were obtained with a 633 nm laser (30 mW), a 100× objective lens, an integration time of 1 s and a step size of 1 μm in StreamLine high-speed acquisition mode.
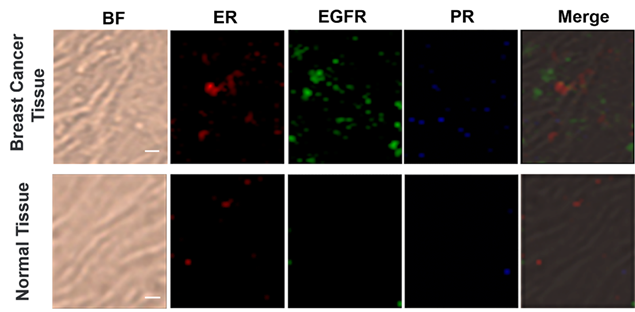
Based on the cellular imaging data, we further explored the use of multiple SERS tags for background-free imaging of ER, EGFR, and PR in human breast cancer tissue specimens. Pretreated tissue slices (5 μm thick) were incubated with 100 μL of mixed probes for 1 hour with slow shaking, and thoroughly washed with PBS buffer; then, the slides were sealed with a small amount of glycerol on a slide for SERS imaging. We recorded the signals at 2000, 2120, and 2230 cm-1, which reflect the expression of ER, EGFR, and PR, respectively. As shown in Figure 5, the breast cancer tissue shows much higher expression levels of these three biomarkers than the normal tissue under identical operating conditions, consistent with the diagnostic and prognostic classification of these tissues based on IHC (Figure S9, ESI†). However, the expression levels of the three biomarkers were slightly different from cancer cells, potentially because the expression profile of cancer cell receptors likely varies from cultured cells to tumors. In addition, in cancer tissue slices from the same tissue, quite different results were obtained if antigen retrieval was not performed, i.e., negligible signals were detected (Figure S10, ESI†). Thus, our SERS tags are a promising and useful platform to facilitate multiplex biomarker imaging in cancer diagnostics.
Multiplex profiling of ER, EGFR, and PR expression in breast cancer tissue and normal tissue sections after treatment with a mixture of tag 1, tag 2, and tag 3 (0.2 nM for each kind of tag). Scale bar: 5 µm. The tissues were analyzed using confocal Raman imaging with a laser excitation wavelength of 633 nm (30 mW). All images were captured with 50× objective lens, an integration time of 1 s and a step size of 1 μm in StreamLine high-speed acquisition mode.
Conclusions
In summary, we have developed a series of SERS tags through the direct coordination of alkyne and nitrile groups with AuNPs, without resorting to the use of a thiol anchor. These background-free Raman reporters were anchored onto AuNPs and displayed strong binding affinity, simplifying the preparation process. Moreover, the Raman signals of the alkyne and nitrile groups appeared in the Raman-silent region (1800 to 2800 cm-1) of biological samples, which is superior to traditional Raman reporters that show signals in the fingerprint region. By screening several molecules that contain either an alkyne or nitrile group, we obtained a series of SERS tags without overlapping peaks for multiplex imaging. The background-free SERS tags enabled us to profile multiple biomarkers expressed in cancer cells and human breast cancer tissues, confirming their great potential for multiplex imaging in clinical diagnosis.
Supplementary Material
Supplementary Figures S1-10.
Acknowledgements
This study was supported by grants from the National Natural Science Foundation of China (21775075, 81771827, and 81471715), the Fundamental Research Funds for Central Universities (China), and the Thousand Youth Talents Plan of China.
Competing Interests
The authors have declared that no competing interest exists.
References
1. Hanash S. Integrated global profiling of cancer. Nat Rev Cancer. 2004;4:638-643
2. Qing Q, Jiang Z, Xu L. et al. Free-standing kinked nanowire transistor probes for targeted intracellular recording in three dimensions. Nat Nanotechnol. 2014;9:142-147
3. Angelo M, Bendall SC, Finck R. et al. Multiplexed ion beam imaging of human breast tumors. Nat Med. 2014;20:436-442
4. Giesen C, Wang HAO, Schapiro D. et al. Highly multiplexed imaging of tumor tissues with subcellular resolution by mass cytometry. Nat Methods. 2014;11:417-425
5. Xianyu Yl, Wu J, Chen YP. et al. Controllable Assembly of Enzymes for Multiplexed Lab-on-a-Chip Bioassays with a Tunable Detection Range. Angew Chem Int Ed. 2018;57:7503-7507
6. Gao WL, Huang T, Yuan HJ. et al. Highly sensitive detection and mutational analysis of lung cancer circulating tumor cells using integrated combined immunomagnetic beads with a droplet digital PCR chip. Talanta. 2018;185:229-236
7. Zhou L, Wang R, Yao C. et al. Single-band upconversion nanoprobes for multiplexed simultaneous in situ molecular mapping of cancer biomarkers. Nat Commun. 2015;6:6938-6949
8. Liu Z, Tabakman S, Sherlock S. et al. Multiplexed five-color molecular imaging of cancer cells and tumor tissues with carbon nanotube Raman tags in the near-infrared. Nano Res. 2010;3:222-233
9. Qian XM, Nie SM. Single-molecule and single-nanoparticle SERS: from fundamental mechanisms to biomedical applications. Chem Soc Rev. 2008;37:912-920
10. Tanwar S, Haldar KK, Sen T. et al. DNA Origami Directed Au Nanostar Dimers for Single-Molecule Surface-Enhanced Raman Scattering. J Am Chem Soc. 2017;139:17639-17648
11. Liu HQ, Li Q, Li MM. et al. In Situ Hot-Spot Assembly as a General Strategy for Probing Single Biomolecules. Anal Chem. 2017;89:4776-4780
12. Kong KV, Lam ZY, Lau WKO. et al. A Transition Metal Carbonyl Probe for Use in a Highly Specific and Sensitive SERS-Based Assay for Glucose. J Am Chem Soc. 2013;135:18028-18031
13. Schluecker S. Surface-Enhanced Raman Spectroscopy: Concepts and Chemical Applications. Angew Chem Int Ed. 2014;53:4756-4795
14. Wang YQ, Yan B, Chen LX. SERS Tags: Novel Optical Nanoprobes for bioanalysis. Chem Rev. 2013;113:1391-1428
15. Kircher MF. How can we apply the use of surface-enhanced Raman scattering nanoparticles in tumor imaging? Nanomedicine. 2017;12:171-174
16. Oseledchyk A, Andreou C, Wall MA. et al. Folate-Targeted Surface-Enhanced Resonance Raman Scattering Nanoprobe Ratiometry for Detection of Microscopic Ovarian Cancer. ACS Nano. 2017;11:1488-1497
17. Wang YW, Doerksen JD, Kang S. et al. Multiplexed Molecular Imaging of Fresh Tissue Surfaces Enabled by Convection-Enhanced Topical Staining with SERS-Coded Nanoparticles. Small. 2016;12:5612-5621
18. Wang YW, Reder NP, Kang S. et al. Raman-Encoded Molecular Imaging with Topically Applied SERS Nanoparticles for Intraoperative Guidance of Lumpectomy. Cancer Res. 2017;77:4506-4516
19. Joo SW, Han SW, Kim K. et al. Adsorption Characteristics of p-Xylene-α, α'-dithiol on Gold and Silver Surfaces: Surface-Enhanced Raman Scattering and Ellipsometry Study. J Phys Chem B. 1999;103:10831-10837
20. Lane LA, Qian XM, Nie SM. SERS Nanoparticles in Medicine: From Label-Free Detection to Spectroscopic Tagging. Chem Rev. 2015;115:10489-10529
21. Lee S, Chon H, Lee J. et al. Rapid and sensitive phenotypic marker detection on breast cancer cells using surface-enhanced Raman scattering (SERS) imaging. Biosensors & Bioelectronics. 2014;51:238-243
22. Nima ZA, Mahmood M, Xu Y. et al. Circulating tumor cell identification by functionalized silver-gold nanorods with multicolor, super-enhanced SERS and photothermal resonance. Scientific Reports. 2014;4:4752-4759
23. Nolan JP, Duggan E, Liu E. et al. Single cell analysis using surface enhanced Raman scattering (SERS) tags. Methods. 2012;57:272-279
24. Li MM, Li J, Di HX. et al. Live-Cell Pyrophosphate Imaging by in Situ Hot-Spot Generation. Anal Chem. 2017;89:3532-3537
25. Di HX, Liu HQ, Li MM. et al. High-Precision Profiling of Sialic Acid Expression in Cancer Cells and Tissues Using Background-Free Surface-Enhanced Raman Scattering Tags. Anal Chem. 2017;89:5875-5881
26. Zhang YQ, Kepcija N, Kleinschrodt M. et al. Homo-coupling of terminal alkynes on a noble metal surface. Nat Commun. 2012;3:286-1293
27. Lee CR, Bae SJ, Gong MS. et al. Surface-enhanced Raman scattering of 4, 4'-dicyanobiphenyl on gold and silver nanoparticle surfaces. J Raman Spectrosc. 2002;33:429-433
28. Wu JZ, Liang DW, Jin QQ. et al. Bioorthogonal SERS Nanoprobes for Multiplex Spectroscopic Detection, Tumor Cell Targeting, and Tissue Imaging. Chem Eur J. 2015;21:12914-12918
29. Ando J, Asanuma M, Dodo D. et al. Alkyne-Tag SERS Screening and Identification of Small-Molecule-Binding Sites in Protein. J Am Chem Soc. 2016;138:13901-13910
30. Maity P, Takano S, Yamazoe S. et al. Binding Motif of Terminal Alkynes on Gold Clusters. J Am Chem Soc. 2013;135:9450-9457
31. Kennedy DC, McKay CS, Tay LL. et al. Carbon-bonded silver nanoparticles: alkyne-functionalized ligands for SERS imaging of mammalian cells. Chem. Commun. 2011;47:3156-3158
32. Qian X, Peng XH, Ansari DO. et al. In vivo tumor targeting and spectroscopic detection with surface-enhanced Raman nanoparticle tags. Nat Biotechnol. 2008;26:83-90
33. Friedrich MG, Kirste VU, Zhu J. et al. Activity of Membrane Proteins Immobilized on Surfaces as a Function of Packing Density. J Phys Chem B. 2008;112:3193-3201
34. Kennedy DC, Tay LL, Lyn RK. et al. Nanoscale Aggregation of Cellular β2-Adrenergic Receptors Measured by Plasmonic Interactions of Functionalized Nanoparticles. ACS Nano. 2009;3:2329-2339
35. Tang Y, Wang J, Cheng JH. et al. Antiestrogenic Activity of Triptolide in Human Breast Cancer Cells MCF-7 and Immature Female Mouse. Drug Dev Res. 2017;78:164-169
36. Yezhelyev MV, Al-Hajj A, Morris C. et al. In Situ Molecular Profiling of Breast Cancer Biomarkers with Multicolor Quantum Dots. Adv Mater. 2007;19:3146-3151
37. Subik K, Lee JF, Baxter L. et al. The Expression Patterns of ER, PR, HER2, CK5/6, EGFR, Ki-67 and AR by Immunohistochemical. Analysis in Breast Cancer Cell Lines. Breast Cancer: Basic and Clinical Research. 2010;4:35-41
Author contact
![]() Corresponding author: Dingbin Liu, E-mail: liudbedu.cn; Pengfei Rong, E-mail: Rongpengfei66com
Corresponding author: Dingbin Liu, E-mail: liudbedu.cn; Pengfei Rong, E-mail: Rongpengfei66com