
 Global reach, higher impact
Nanotheranostics 2018; 2(1):12-20. doi:10.7150/ntno.22419 This issue Cite
Research Paper
A dual biomarker detection platform for quantitating circulating tumor DNA (ctDNA)
Chunyan Cai1*, Zhenzhong Guo2*, Yiping Cao1 ![]() , Weiying Zhang1
, Weiying Zhang1 ![]() , Yong Chen1,3
, Yong Chen1,3
1. Institute for Interdisciplinary Research, Key Laboratory of Optoelectronic Chemical Materials and Devices of Ministry of Education, Jianghan University, Wuhan 430056, PR China;
2. Hubei Province Key Laboratory of Occupational Hazard Identification and Control, Medical College, Wuhan University of Science and Technology, Wuhan 430065, P.R.China;
3. Ecole Normale Supérieure, CNRS-ENS-UPMC UMR 8640, 24 Rue Lhomond, Paris 75005, France.
* These authors contributed equally.
Received 2017-8-21; Accepted 2017-10-12; Published 2018-1-1
Abstract

Circulating tumor DNA (ctDNA), which includes DNA mutations, epigenetic alterations and other forms of tumor-specific abnormalities, is a promising “real-time” biomarker for noninvasive cancer assessment. Tumor DNA is of great value in the process of cancer treatment, including diagnostic and prognostic information before, during treatment and at progression. Here we introduce a peptide nucleic acids probe-gold nanoparticles (PNA-AuNPs) and lead phosphate apoferritin (LPA)-based dual biomarker detection platform, which could be used in a DNA biosensor to quantify ctDNA by detection of tumor-specific mutations and methylation of PIK3CA gene. On the one hand, PNA probe and anti-5-Methylcytosine monoclonal antibody (anti-5-mC) were used to recognize the different parts of ctDNA, forming a sandwich-structure on a screen-printed electrode (SPE) surface. On the other hand, AuNPs and LPA were introduced to construct the biosensor for double signal amplification. Square-wave voltammetry (SWV) was used to monitor the electrochemical signal of lead ions released from apoferritin. The proposed DNA biosensor yielded a linear current response to ctDNA concentrations over a broad range of 50-10000 fM with a detection limit of 10 fM. It also successfully detected ctDNA collected from cancer patient serum. Therefore, we anticipate this new platform opens up an approach to detect and monitor diverse malignancies, facilitating personalized cancer therapy.
Keywords: circulating tumor DNA, DNA biosensor, cancer diagnosis, peptide nucleic acids probe, apoferritin.
Introduction
Cancer is a leading cause of death globally which needs appropriate diagnosis methods. Currently, most therapy decisions are solely based on tissue biopsies, as an invasive test, which can be a burden to the patients. Additionally, most tumors are composed of multiple subclones which are constantly evolving [1]. However, tissue biopsies provide just a static snapshot of the tumor at the time of biopsy and do not necessarily represent the entire tumor genome [2]. Therefore, it is of great value to develop noninvasive detecting methods that could monitor the real-time dynamic of cancer. “Liquid biopsy” may be an ideal one for patients with cancer, as it could provide valuable information of current tumor dynamics, facilitate monitoring of systemic anticancer therapy, and help in identifying appropriate therapeutic targets [3-5]. Early research suggested that circulating tumor cell capture and analysis had potential as a noninvasive marker of tumor diagnosis [6], however clinical development of these technologies have been slow. Several studies have now suggested that highly sensitive assays can detect the concentration of circulating tumor DNA (ctDNA), which is significantly higher in cancer patients compared with healthy individuals, potentially reflecting the biology of a patient's cancer [7-10].
Recent advances in noninvasive diagnostics highlight the clinical potential of ctDNA, but also the challenges involved in analysis of it. Tumor DNA is fragmented to an average length of 50 to 250 base pairs (bp) and is present in only a few thousand amplifiable copies per milliliter of blood, of which only a fraction may be diagnostically relevant [11, 12]. Various technology platforms for ctDNA analysis have been developed using different strategies such as dPCR [13], bead emulsion amplification magnetic (BEAMing) [14], tagged-amplicon deep sequencing (TAM-Seq) [15] and CAncer Personalized Profiling by deep Sequencing (CAPP-Seq) [16]. Although these technologies have led to significant contributions to ctDNA detection, further application is still hindered by expensiveness, low sensitivity, tedious steps, harmful reagents and sophisticated instruments. Thus, the development of a novel and sensitive platform that enhances ctDNA analysis efficiency would dramatically increase the use of ctDNA in diagnostics, prognostics and targeted therapy. Tumor DNA can be detected by tracking tumor-specific mutations or gene methylation. Mutation at two hot spots of E542K and E545K and methylation of ctDNA of PIK3CA are well-known mutations in many types of cancers including stomach, breast, lung, liver, colon and brain [17-19]. Based on above, we developed a new platform for ctDNA analysis on the basis of dual biomarker: genetic mutation and methylation alteration, which could increase the sensitivity and specificity of ctDNA based diagnostics.
In view of small size, low concentration and free floating of ctDNA in the peripheral blood, capturing and enriching ctDNA targets are essential steps to completely eliminate unspecific binding. Peptide nucleic acid (PNA), the artificially synthesized DNA analog with an uncharged peptide backbone [20], has a great potential to be used as a probe for DNA biosensor. The hybrid formed between PNA and its complementary DNA is more stable than the corresponding DNA/DNA hybrid due to the absence of electrostatic repulsion between negative charges along the phosphate backbone existing in the DNA structure [21]. This characteristic makes PNA probe more acceptable to use in mutation detection studies because PNA probe makes a large difference in ΔTm (15 oC) between perfect match and single mismatch, including even insertion and deletion. Therefore, PNA molecules could be an ideal probe to target ctDNA accurately, which eliminate nonspecific interference on the sensor platform under thermally controlled conditions.
Current strategies for quantification of ctDNA mutation are localized surface plasmon resonance [22], surface enhanced Raman scattering [23, 24] and digital PCR [13]. Electrochemical immunoassays and biosensors have evolved dramatically over the past decades and have been successfully used for in-field biomarker detection and clinical diagnosis [25] due to their rapidity, portability, simplicity and low-cost. In order to meet the increasing demand for ultrasensitive detection, the sensitivities of conventional biosensor need to be further enhanced by using novel signal amplification strategy. One of the most popular amplification is the introduction of nanoparticles, such as gold nanoparticles, carbon nanotubes, graphene oxide, and silica nanoparticles [26-28]. Besides, protein cages, such as apoferritin, also have been reported as an immuno-label to enhance detection sensitivity [29]. Apoferritin, an iron storage protein with a diameter of 12.5 nm, could act as a nanoreactor to synthesize voltammetrically distinguishable metal phosphates inside [30] for signal amplification of biosensor.
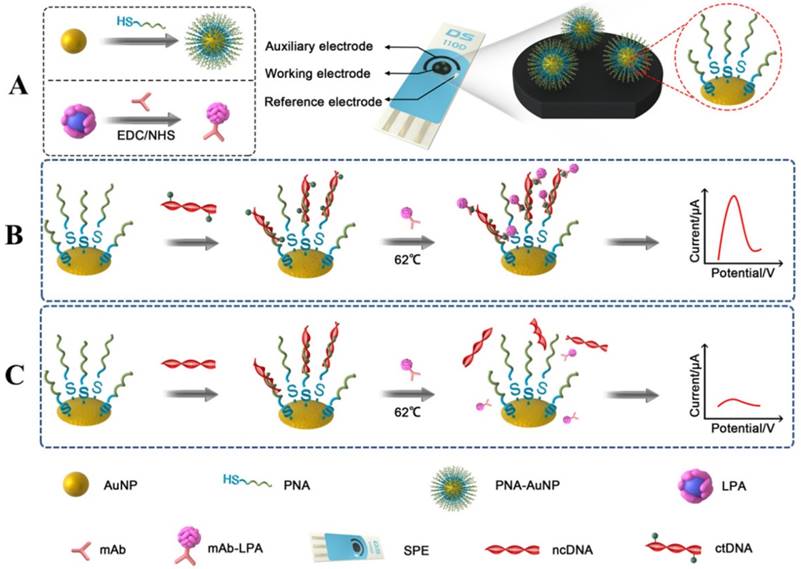
Herein, we demonstrate initial work toward developing an ultrasensitive, highly selective, and disposable ctDNA biosensor based on a dual biomarker platform. In this platform, ctDNA was effectively enriched since PNA and 5-Methylcytosine monoclonal antibody (anti-5-mC) were used to recognize the different biomarker (tumor-specific mutation and epigenetic methylation, respectively) of ctDNA, thereby forming a sandwich-like DNA biosensor, which could analysis ctDNA both in complex biological matrices and cancer patient serum. For ctDNA biosensor fabrication, as shown in Scheme 1, AuNPs were served as nanocarrier to immobilize more PNA probes to form PNA-AuNPs conjugate, which could enrich more ctDNA, thus enhancing the electrochemical detection signal. PNA probes were designed with matching for E542K and E545K perfectly, with one mismatch for normal circulating DNA (ncDNA). Moreover, lead phosphate apoferritin loaded with anti-5-mC (LPA-anti-5-mC) could improve the selectivity of the target ctDNA and amplify the signal in further. In presence of ctDNA, PNA-AuNPs/ctDNA/LPA-anti-5-mC sandwich-format system could be constructed on a disposable screen-printed electrode (SPE) surface (Scheme 1B). Highly specific and sensitive detection of ctDNA was achieved by the electrochemical signal of lead ions released from apoferritin. Conversely, as ncDNA neither matched perfectly with the PNA-AuNPs probe, nor reacted with LPA-anti-5-mC, no sandwich-structure could be formed (Scheme 1C). Combined with more accurate sequencing technologies and specific immune response, as well as double amplification strategies, the proposed DNA biosensor exhibited excellent sensitivity and selectivity, indicating great potential for target analysis and personalized therapy at point of care.
(A) Schematic diagrams of preparation of PNA-AuNPs conjugates and LPA-anti- 5-mC bioconjugate. (B) and (C) Schematic illustration of DNA biosensor and ctDNA detection.
Experimental
Reagents
The oligonucleotides used in this study had the following sequences: PNA probe for hot-spot E542K: 5′-HS-AGTGATTTTAGAGAG; PNA probe for E542K: 5′-HS-CCTGCTTAGTGATTT; ctDNA: 5'-CAmCGAGATCCTCTCTCTGAAATCACTGAGCAGGAGAAAGATTTTCTATGGAGTCACAGACACTATTGTG and 3'-GTGCTCTAGGAGAGAGACTTTAGTGACTmCGTCCTCTTTCTAAAAGATACCTCAGTGTCTGTGATAACAC were purchased from TSINGKE Biotech. Co., Ltd. (Wuhan, China). Apoferritin, lead nitrate, human serum (H4522), avidin, biotin N-hydroxysulfosuccinimide (biotin-NHS), bovine serum albumin (BSA), phosphate buffered saline (PBS), acetate buffer and Tris-HCl buffer were the products of Sigma-Aldrich. Monoclonal anti-5-Methylcytosine antibody (anti-5-mC) was obtained from Epigentek Group Inc. (Farmingdale, NY). AuNPs were purchased from XFNANO (Nanjing, China). Cancer patient serum was provided by Zhongnan Hospital of Wuhan University (Wuhan, China). Other reagents were commercially available and were of analytical grade. All solutions were prepared using ultrapure water (≥18 MΩ, Millipore).
Apparatus
SWV measurements were carried out on a CHI 660C workstation (CH Instruments Inc., Shanghai, China). SPE consisting of a carbon working electrode, a carbon auxiliary electrode, and an Ag/AgCl reference electrode (Scheme 1) were purchased from DropSens (Asturias, Spain) for electrochemical measurement. A sensor connector was used to connect the SPE to the CHI 660C workstation. TEM micrographs obtained on a Tecnai G2 F20 S-TWIN (FEI, USA). The UV-vis absorption spectra were recorded on a UV-2550 spectrophotometer (Shimadzu, Japan). The EQCM instrument is composed of quartz crystal microbalance (QCM200 Stanford research systems), which was used to measure in situ changes in mass (measured by the frequency shift Δf).
Preparation of PNA-AuNPs conjugates
PNA-AuNPs conjugates were prepared according to the previous report [31, 32] with slight modification. Briefly, AuNPs were first modified with alkanethiol oligonucleotides by adding 10 μL PNA to 200μL AuNPs solution. After being incubated for 24 h at room temperature, the solution was adjusted to the pH value and ionic strength of the PBS (10 mM, pH 7.0) and allowed to stand for 6 h. Then 1 M NaCl was added to the solution to bring the total NaCl concentration of the solution to 0.05 M. The process was repeated 14 h later by adjusting the NaCl concentration to 0.1 M. The solution was stabilized under these conditions for additional 24 h. Excess oligonucleotides were then removed by centrifugation for 30 min at 12,000 rpm. Following removal of the supernatant, the red PNA-AuNPs conjugates were washed three times with 0.1 M NaCl, PBS (pH 7.0) by centrifugation. Finally, the red PNA-AuNPs conjugates were dispersed in 1 mL ddH2O and stored at 4℃. AuNPs and PNA-AuNPs were characterized by TEM and UV-vis.
Preparation of LPA nanoparticles
The preparation of LPA nanoparticles was performed as follow [29]: 40 μL apoferritin (50 mg mL-1) was first diluted with 0.1 M Tris-HCl to a volume of 2.0 mL. Secondly, 250 μL lead nitrate (6 mM) was slowly introduced into the above apoferritin solution, and the mixture was continuously stirred for 1 h to allow the lead ions to diffuse into the cavity of apoferritin. Then 250 μL PBS (pH 7.0) was added drop-by-drop and the mixture was stirred for another hour to form a phosphate metal core inside the apoferritin. The mixture was centrifuged for 5 min at 5,000 rpm. The supernatant was washed three times with Tris-HCl using an Amicon filter (MWCO = 25,000). Finally, the prepared LPA nanoparticles were reconstituted into a 1.0 mL solution and stored at 4℃.
Preparation of LPA-anti-5-mC bioconjugate
The LPA-anti-5-mC was prepared using an avidin as a bridge to link biotin modified anti-5-mC and LPA [33]. Herein, avidin was used to connect biotin-LPA and biotin-anti-5-mC since avidin possesses 4 active sites which will react with one biotin residue and operate as acceptor for another biotin-labeled protein. Briefly, 800 μL of the above prepared LPA nanoparticles were mixed with 200 μL biotin-NHS (0.1 mg mL-1) and stirred for 3 h at room temperature. The mixture was dialyzed against Tris-HCl overnight to remove excess biotin-NHS. The resulting biotin-LPA was reconstituted into a 1.0 mL solution containing 0.5% BSA and stored at 4 oC. The same process was performed to prepare the biotin-anti-5-mC. Subsequently, 1 mL avidin (0.06 mg mL-1) was mixed with biotin-LPA and reacted for 2 h to form avidin-biotin-LPA conjugate. Then an amount of biotin-anti-5-mC was added at an equal molar equivalent to the avidin-biotin-LPA solution and the reaction proceeded for another 2 h. Excess agents were removed using an Amico filter (MWCO = 300,000). The resulting anti-5-mC-biotin-avidin-biotin-LPA (i.e. LPA-anti-5-mC) was dispersed in Tris-HCl buffer containing 1% BSA and kept at 4 oC for the following experiment.
Construction of DNA biosensor
Before the experiments, the SPE was washed with distilled water and dried with nitrogen. PNA-AuNPs solution containing 0.05% (w/v) chitosan was dropped onto the working electrode surface of the SPE. After washing with distilled water and dried, 100 μL ctDNA or ncDNA at the desired concentration was then introduced onto the PNA-AuNPs modified SPE and retained in an incubator at 62 °C for 30 min [10]. After washing by PBS at 62 °C, ncDNA was washed away due to different melting temperature. Then SPE was incubated with LPA-anti-5-mC bioconjugate for another 30 min, followed by rinsing with Tris-HCl buffer thoroughly to remove the physical adsorption of LPA-anti-5-mC on the SPE. An aliquot of HCl was dropped on the working electrode of SPE to dissolve the captured LPA. The detection solution containing 0.5 μg mL-1 Bi in acetate buffer (0.2 M pH 4.5) was added on the above PNA-AuNPs/LPA-anti-5-mC/ctDNA SPE for 5 min to release lead ions from the apoferritin. This is followed by SWV detection of the released lead ions at an in situ plated bismuth film electrode.
Serum sampling and detection
Serum samples were collected from ten cancer patients and four of them randomly chosen for the experiments. For detecting human concentration of ctDNA, 100 μL of serum was added onto the PNA-AuNPs modified SPE and incubated for 30 min. Then SPE was incubated with LPA-anti-5-mC bioconjugate for another 30 min, followed by dropping with HCl. The results were quantified by SWV detection with electrochemical workstation. Serum sampling was done according to ethics principles set out by the biosafety committee at Zhongnan Hospital of Wuhan University and consent forms were signed by all donors.
Results and Discussion
Characterization of the AuNPs, PNA-AuNPs conjugates and LPA nanoparticles
AuNPs and PNA-AuNPs conjugates were characterized by UV-vis spectrophotometer. Fig. 1A shows that the plasmonic peak of AuNPs surface modified with PNA probe has a red shift about 4 nm. This plasmonic damping was consistent with the previous reports [22]. Moreover, transmission electron microscopy (TEM) was used to observe the AuNPs and PNA-AuNPs (inset of Fig. 1A). The bare AuNPs diameter was 40 nm ± 2 nm, but dispersion of PNA-AuNPs was significantly better than the pure AuNPs, which is because strong intermolecular repulsions among the negatively charged phosphodiester backbones of PNA probe increase the stability of PNA-AuNPs [34]. These results demonstrated a successful PNA probe modification on the AuNPs surface.
(A) UV-absorption spectrum of AuNPs (black curve) and PNA-AuNPs (red curve); TEM images of AuNPs (inset a) and PNA-AuNPs (inset b). (B) TEM image of lead phosphate-apoferritin nanoparticles.
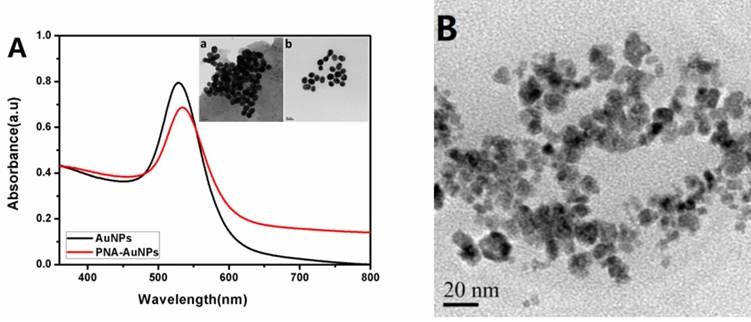
As shown in Fig. 1B, the individual particles are discrete, spherical and uniform with a diameter of about 12 nm, and the dense lead phosphate cores appear black and are surrounded by an amorphous protein shell. It seems to confirm that lead ions were encapsulated into the core of the apoferritin. We calculated the loading amount of metal ions per apoferritin by comparing the concentrations of apoferritin and lead ions in the nanoparticle solution. The concentrations of apoferritin and metal ions were determined by the BCA method and ICP, respectively. The numbers of lead ions are 1300 per apoferritin with a standard deviation of ±90 (n=6).
Evaluation of immunoaffinities
Nonspecific adsorption is one of the most important factors in development of nanoparticle-based DNA biosensor. Electrochemical quartz crystal microbalance (EQCM) and electrochemical methods were used to monitor the interaction among PNA, ctDNA and anti-5-mC antibodies. As shown in Fig. 2A, the frequency changes (Δf) included the changing trends and well reproduced EQCM response. Before adding samples, the EQCM was initially equilibrated with Tris-HCl for 30 min, until stable baseline for Δf was achieved. After attaching ctDNA, as expected, it resulted great decrease in Δf response, indicating successful capture of ctDNA onto the PNA-AuNPs modified SPE surface (curve a). Further decrease of Δf resulted from the introduction of LPA-anti-5-mC which was recognized by ctDNA based on immnointeraction. We also observed that two recognitions were completed both within 30 min. Besides, we used ncDNA as control for comparison (curve b). It showed that the resulting response of Δf is very weak, which further proved strong interaction between PNA-AuNPs and ctDNA.
(A) EQCM measurements for recognizing (a) ctDNA and (b) ncDNA, respectively. (B) SWV responses of the DNA biosensor for (a) PBS, (b) 1% BSA, (c) 1000 fM ncDNA, (d) 10 fM ctDNA and (e) 1000 fM ctDNA.
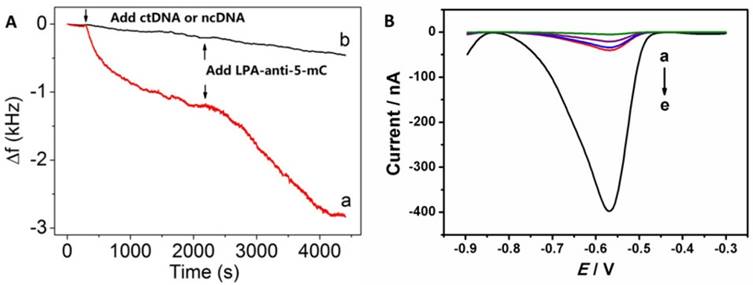
Furthermore, Square-wave voltammetry (SWV) measurements were used to confirm the above immunoaffinities. Here, 20 fM ctDNA, 1000 fM ncDNA, PBS and 1% BSA were served as controls to be simultaneously examined as the challenging proteins. As shown in Fig. 2B, there are no detectable signals in PBS (curve a) and very small currents in BSA (curve b), 1000 fM ncDNA(curve c) and 10 fM ctDNA (curve d). However, a well-defined voltammetric peak from 1000 fM ctDNA loading on SPE is distinguished (curve e), indicating the strong affinity among PNA, ctDNA and anti-5-mC antibodies to form sandwich-like PNA-AuNPs/ctDNA/LPA-anti-5- mC complex. These observations suggest that the effects of non-specific adsorption could be neglected.
Optimization of detection conditions for ctDNA
Since the PNA-AuNPs conjugates were used here as capturing platform, the amount of PNA on the surface of AuNPs influenced the amount of captured ctDNA, and this accounted for the amount of LPA-anti-5-mC. One can see from Fig. 3A that the voltammetric currents increased upon raising the concentrations of the PNA on the surface of AuNPs and achieved the highest signal at 6 mM PNA. Thus, 6 mM PNA was used in the experiments.
Effects of parameters on immunosensing responses. (A) Concentration of PNA, (B) incubation time including PNA capture (black) and LPA-anti-5-mC recognition (red).
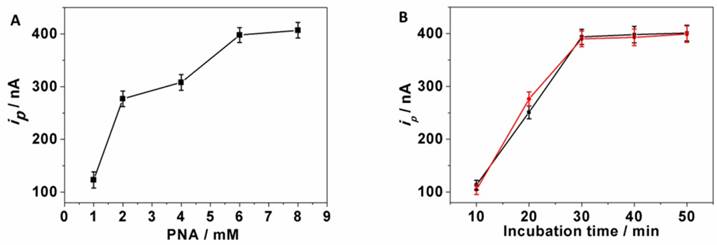
The current responses also depended on the incubation time of both PNA capturing and LPA-anti-5-mC recognition of ctDNA. As shown in Fig. 3B that both the responses increased with increasing incubation time and tended to steady values after 30 min (black and red curve), which was used for the construction of DNA sensor. These results were consistent with the EQCM results above.
Electrochemical measurements on the DNA biosensor
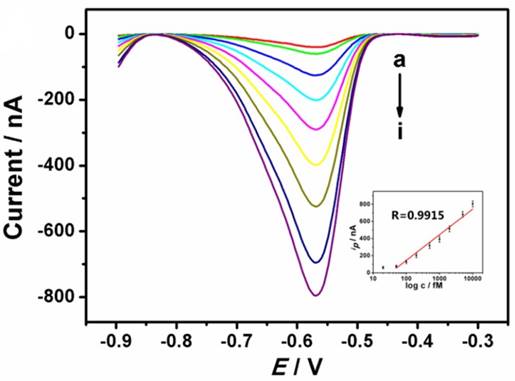
For the detection of ctDNA, high sensitivity and selectivity play important roles in improving the treatment. In view of this, the proposed DNA biosensor was challenged with different concentrations of ctDNA, as shown in Fig. 4. The SWV currents (from lead ions) increased with the increasing concentration of ctDNA from 20 fM to 10000 fM. The resulting calibration plot of current versus known concentration of ctDNA (Fig. 4 inset) is linear over 50 fM to 10000 fM range, with the detection limit of 10 fM, which is comparable to the previous reported value [22, 23]. This method shows more advantages in its simplicity, rapidity and low cost. Since the average concentration of ctDNA in cancer patient plasma is more than 200 fM [3], the proposed device is sensitive enough to detect low-dose ctDNA. A series of six measurements of 1000 fM ctDNA yielded reproducible electrochemical responses with an RSD of 5.3% (data not shown), indicating acceptable reproducibility. In addition, the DNA biosensor could be stored at 4 ◦C. In this way, over 80% of the initial response remained after one month, indicating acceptable stability.
Typical electrochemical response of the DNA biosensor with the increasing concentration of ctDNA (20, 50, 100, 200, 500, 1000, 2000, 5000, 10000 fM from a to i). The inset shows the resulting calibration plot of ctDNA.
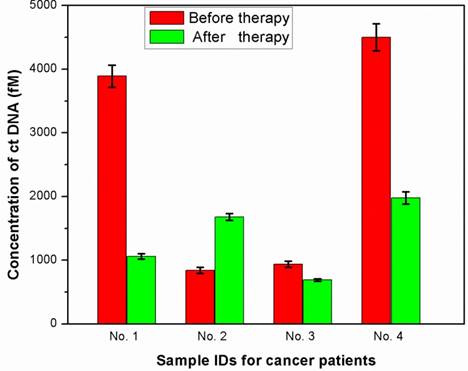
To explore the use of the biosensor for monitoring biological matrices, human plasma samples were spiked with ctDNA to final concentrations of 50, 200, 1000, 5000 and 10000 fM. Analysis of 100 μL of sample was performed using the DNA biosensor. The results were summarized in Table 1, which showed the recoveries are calculated to be in the range of 99.0-104.2%. Furthermore, the proposed DNA biosensor was used to measure ctDNA level in serum collected from four cancer patients before and after therapy. Figure 5 shows the ctDNA levels of four volunteers as measured by our device. For the calculation of the analyte concentrations, the current normalized responses of the DNA biosensor were correlated with the calibration curves depicted in Figure 4. As shown in Figure 5 and Table 2, when the treatment was beneficial, as determined by decrease in tumor size or reduction of pain, a decrease concentration of ctDNA also was observed. Conversely, when the treatment was unsuccessful, ctDNA levels tended to remain unchanged or even increased. Successfully detecting the ctDNA from cancer patient serum displays promise of our DNA biosensor for various biomonitoring applications in the near future.
Comparison of DNA biosensor values with known concentrations of ctDNA spiked in human plasma
| Sample No. | 1 | 2 | 3 | 4 | 5 |
|---|---|---|---|---|---|
| Known (fM) | 50 | 200 | 1000 | 5000 | 10000 |
| DNA biosensor (fM) | 52.11±1.09 | 203.69±3.41 | 991±10.81 | 5087.72±99.78 | 9899.09±129.06 |
| Recovery (%) | 104.2% | 101.8% | 99.1% | 101.8% | 99.0% |
Detection of ctDNA in the serum samples collected from cancer patients. Red color: before chemotherapy; Green color: after chemotherapy. The concentration of ctDNA was calculated from the calibration curve.
The patient informations and ctDNA levels (fM) before and after treatment
| Patient No. | 1 | 2 | 3 | 4 |
|---|---|---|---|---|
| Cancer type | Breast | Lung | Ovary | Rectum |
| Age | 49 | 55 | 51 | 36 |
| Gender | Female | Male | Female | Female |
| Treatment approach | Radiotherapy | Chemotherapy | Chemotherapy | Chemotherapy |
| Before therapy | 3890.09±172.32 | 839.9±47.72 | 939.01±49.99 | 4502.02±214.38 |
| After therapy | 1060.11±43.33 | 1680.68±52.91 | 690.67±20.09 | 1979.55±96.68 |
| Effect of therapy | Decreased | Increased | Unchanged | Decreased |
Conclusions
In summary, we have successfully developed a dual biomarker and double amplification strategy-based detection platform and have demonstrated its use in an ultrasensitive and selective DNA biosensor for the analysis of ctDNA of PIK3CA gene. In this detection system, PNA probe and anti-5-mC were used to recognize the tumor-specific mutation and methylation of ctDNA, respectively, in order to improve the selectivity of the sensor. AuNPs played the role of nanocarrier to co-immobilize PNA probes at a high ratio, which could enrich more ctDNA, enhancing detection signal greatly. Additionally, apoferritin with the hollow structure was used to form metallic phosphates inside the cavity as voltammetrically distinguishable signal reporters to further improving detection sensitivity. Among the various technologies developed to analysis ctDNA to date, this is the first strategy to combine dual biomarker and an electrochemical biosensor for quantitative detection of ctDNA. More significantly, we have demonstrated the use of sensor to detect ctDNA both in complex biological matrices and cancer patient serum with satisfactory results. Therefore, we anticipate that this platform can be extended for the quantification of other nucleic acids or proteins, and we believe that it offers promising potential in the field of cancer diagnosis and personalized therapy.
Acknowledgements
This work was supported by the National Natural Science Foundation of China (31600801) and the Basic Research for Application Project (2015011701011595, 2017060201010207). W. Z. would like to acknowledge the support from a Jianghan University start-up grant.
Competing Interests
The authors have declared that no competing interest exists.
References
1. Schilsky RL. Implementing personalized cancer care. Nat Rev Clin Oncol. 2014;11:432-8
2. Jamal-Hanjani M, Quezada SA, Larkin J, Swanton C. Translational implications of tumor heterogeneity. Clin Cancer Res. 2015;21:1258-66
3. Calapre L, Warburton L, Milward M, Ziman M, Gray ES. Circulating tumour DNA (ctDNA) as a liquid biopsy for melanoma. Cancer Lett. 2017;4:62-9
4. Li N, Xiao T, Zhang Z, He R, Wen D, Cao Y, Zhang W, Chen Y. A 3D graphene oxide microchip and a Au-enwrapped silica nanocomposite-based supersandwich cytosensor toward capture and analysis of circulating tumor cells. Nanoscale. 2015;7:16354-60
5. Crowley E, Nicolantonio FD, Loupakis F, Bardelli A, Liquid biopsy. monitoring cancer-genetics in the blood. Nat Rev Clin Oncol. 2013;10:472-84
6. Alix-Panabières C, Pantel K. Challenges in circulating tumour cell research. Nat Rev Cancer. 2014;14:623-31
7. Hong B, Zu Y. Detecting Circulating Tumor Cells: Current Challenges and New Trends. Theranostics. 2013;3:377-94
8. Heitzer E, Ulz P, Geigl JB. Circulating tumor DNA as a liquid biopsy for cancer. Clin Chem. 2015;61:112-23
9. Newman AM, Lovejoy AF, Klass DM, Kurtz DM, Chabon JJ, Scherer F, Stehr H, Liu CL, Bratman SV, Say C, Zhou L, Carter JN, West RB, Sledge GW, Shrager JB, Loo BW, Neal JW, Wakelee HA, Diehn M, Alizadeh AA. Integrated digital error suppression for improved detection of circulating tumor DNA. Nat Biotechnol. 2016;34:547-55
10. Wan JCM, Massie C, Garcia-Corbacho J, Mouliere F, Brenton JD, Caldas C, Pacey S, Baird R, Rosenfeld N. Liquid biopsies come of age: towards implementation of circulating tumour DNA. Nat Rev Cancer. 2017;17:223-38
11. Alix-Panabières C, Schwarzenbach H, Pantel K. Circulating tumor cells and circulating tumor DNA. Annu Rev Med. 2012;63:199-215
12. Mok T, Wu YL, Lee JS, Yu CJ, Sriuranpong V, Sandoval-Tan J, Ladrera G, Thongprasert S, Srimuninnimit V, Liao M, Zhu Y, Zhou C, Fuerte F, Margono B, Wen W, Tsai J, Truman M, Klughammer B, Shames DS, Wu L. Detection and dynamic changes of EGFR mutations from circulating tumor DNA as a predictor of survival outcomes in NSCLC patients treated with first-line intercalated erlotinib and chemotherapy. Clin Cancer Res. 2015;21:3196-203
13. Brychta N, Krahn T, von Ahsen O. Detection of KRAS mutations in circulating tumor DNA by digital PCR in early stages of pancreatic cancer. Clin Chem. 2016;62:1482-91
14. Richardson AL, Iglehart JD. BEAMing up personalized medicine: mutation detection in blood. Clin Cancer Res. 2012;18:3209-11
15. Lawson AR, Plagnol V, Fahem A, Forshew T, Brenton JD, Gale D, Rosenfeld N. Assessment of clinical applications of circulating tumor DNA using an enhanced TAm-Seq platform. Cancer Res. 2015;75:2412
16. Chabon JJ, Simmons AD, Lovejoy AF, Esfahani MS, Newman AM, Haringsma HJ, Kurtz DM, Stehr H, Scherer F, Karlovich CA, Harding TC, Durkin KA, Otterson GA, Purcell WT, Camidge DR, Goldman JW, Sequist LV, Piotrowska Z, Wakelee HA, Neal JW, Alizadeh AA, Diehn M. Circulating tumour DNA profiling reveals heterogeneity of EGFR inhibitor resistance mechanisms in lung cancer patients. Nat Commun. 2016;7:11815
17. Xu T, Kang X, You X, Dai L, Tian D, Yan W, Yang Y, Xiong H, Liang Z, Zhao GQ, Lin S, Chen KN, Xu G. Cross-platform comparison of four leading technologies for detecting EGFR mutations in circulating tumor DNA from non-small cell lung carcinoma patient plasma. Theranostics. 2017;7:1437-46
18. Ying H, Depinho RA. Cancer signaling: when phosphorylation meets methylation. Cell Res. 2014;24:1282-3
19. Martincorena I, Campbell PJ. Somatic mutation in cancer and normal cells. Sci. 2015;349:1483-9
20. Mcneer NA, Anandalingam K, Fields RJ, Caputo C, Kopic S, Gupta A, Quijano E, Polikoff L, Kong Y, Bahal R, Geibel JP, Glazer PM, Saltzman WM, Egan ME. Nanoparticles that deliver triplex-forming peptide nucleic acid molecules correct F508del CFTR in airway epithelium. Nat Commun. 2015;6:6952
21. Honarvar H, Westerlund K, Altai M, Sandstrom M, Orlova A, Tolmachev V, Karlstrom AE. Feasibility of affibody molecule-based PNA-mediated radionuclide pretargeting of malignant tumors. Theranostics. 2016;6:93-103
22. Nguyen AH, Sim SJ. Nanoplasmonic biosensor: Detection and amplification of dual bio-signatures of circulating tumor DNA. Biosens Bioelectron. 2015;67:443-9
23. Wee EJH, Wang Y, Chang-Hao TS, Matt T. Simple, Sensitive and accurate multiplex detection of clinically important melanoma DNA mutations in circulating tumour DNA with SERS nanotags. Theranostics. 2016;6:1506-13
24. Zhou Q, Zheng J, Qing Z, Zheng M, Yang J, Yang S, Ying L, Yang R. Detection of circulating tumor DNA in human blood via DNA-mediated surface-enhanced raman spectroscopy of single-walled carbon nanotubes. Anal Chem. 2016;88:4759-65
25. Ge X, Zhang W, Lin Y, Du D. Magnetic Fe3O4@TiO2 nanoparticles-based test strip immunosensing device for rapid detection of phosphorylated butyrylcholinesterase. Biosens Bioelectron. 2013;50:486-91
26. Hsu SC, Cheng HT, Wu PX, Weng CJ, Santiago KS, Yeh JM. Electrochemical sensor constructed using a carbon paste electrode modified with mesoporous silica encapsulating PANI chains decorated with GNPs for detection of ascorbic acid. Electrochim Acta. 2017;238:246-56
27. Cheraghi S, Taher MA. Fabrication of CdO/single wall carbon nanotubes modified ionic liquids carbon paste electrode as a high performance sensor in diphenhydramine analysis. J Mol Liq. 2016;219:1023-29
28. Zhang W, Ge X, Tang Y, Du D, Liu D, Lin Y. Nanoparticle-based immunochromatographic test strip with fluorescent detector for quantification of phosphorylated acetylcholinesterase: an exposure biomarker of organophosphorus agents. Analyst. 2013;138:5431-6
29. Tian L, Dai Z, Liu X, Song B, Ye Z, Yuan J. Ratiometric time-gated luminescence probe for nitric oxide based on an apoferritin-assembled lanthanide complex-rhodamine luminescence resonance energy transfer system. Anal Chem. 2015;87:10878-85
30. Iwahori K, Yamane M, Fujita S, Yamashita I. Synthesizing CdSe nanoparticles by using a low concentration of cadmium ions and the apoferritin protein cage of marine pennate diatoms. Mater Lett. 2015;160:154-57
31. Mirkin CA, Letsinger RL, Mucic RC, Storhoff JJ. A DNA-based method for rationally assembling nanoparticles into macroscopic materials. Nature. 1996;382:607-9
32. Kanjanawarut R, Su X. Colorimetric detection of DNA using unmodified metallic nanoparticles and peptide nucleic acid probes. Anal Chem. 2009;81:6122-9
33. Guesdon JL, Ternynck T, Avrameas S. The use of avidin-biotin interaction in immunoenzymatic techniques. J Histochem Cytochem. 1979;27:1131-9
34. Kong FY, Zhu X, Xu MT, Xu JJ, Chen HY. Gold nanoparticle/DNA/methylene blue nanocomposites for the ultrasensitive electrochemical detection of carcinoembryonic antigen. Electrochim Acta. 2011;56:9386-90
Author contact
![]() Corresponding authors: Email: weiying.zhangedu.cn (W. Zhang), cypedu.cn (Y. Cao)
Corresponding authors: Email: weiying.zhangedu.cn (W. Zhang), cypedu.cn (Y. Cao)